File:Hu et al (2012) Fig.2A.PNG
From Bioblast
Size of this preview: 456 × 600 pixels. Other resolution: 626 × 823 pixels.
Original file (626 × 823 pixels, file size: 121 KB, MIME type: image/png)
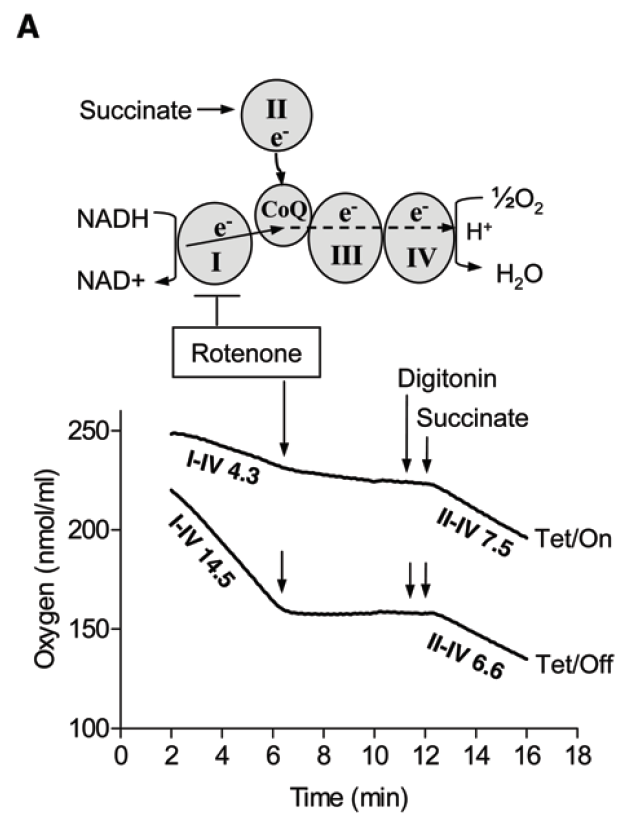
Fig.2A from Hu et al (2012) showing experimental rationale of analyzing mitochondrial complex I and II activities and representative oxygen consumption curve of T-Rex-293 cells before and after K-ras induction for 48 h. The numbers indicate oxygen consumption rate (nmol/ml/min) of mitochondrial complex I to IV and II to IV. Arrows indicate the time points when reagents were added. Rotenone: 100 nM; digitonin: 30 μg/ml; succinate: 5 μM.
File history
Click on a date/time to view the file as it appeared at that time.
| Date/Time | Thumbnail | Dimensions | User | Comment | |
|---|---|---|---|---|---|
| current | 11:07, 2 June 2017 | | 626 × 823 (121 KB) | Bufe Anja (talk | contribs) | Fig.2A from Hu et al (2012) showing experimental rationale of analyzing mitochondrial complex I and II activities and representative oxygen consumption curve of T-Rex-293 cells before and after K-ras induction for 48 h. The numbers indicate oxygen cons... |
You cannot overwrite this file.
File usage
There are no pages that use this file.
_Fig.2A.PNG&oldid=136127)