From Bioblast
 |
Mark statistics - DatLab |
MitoPedia O2k and high-resolution respirometry:
O2k-Open Support
Description
In Mark statistics one Plot is selected as a source for Marks over sections of time. Values (e.g. medians) are displayed for these time sections of the source plot and of all selected plots.
Abbreviation: F2
Reference: MitoPedia:_DatLab
Contributed by Gnaiger Erich and Cardoso Luiza HD 2016-03-09, last update 2020-03-05.
Action
- Set the Marks in DatLab on a selected (active) Plot.
- Go to the menu Marks and select in which format the Marks shall be displayed:
- Depending on whether or not you use DL-protocols, chose:
- - [Flux/flow + all info]: contains the information saved in the Mark information window and the values of flux or flow, according to the layout selected, corrected for Instrumental background oxygen flux. To obtain the background corrected sample-specific flux, it is crucial to first select the respective standard layout (5 or 6) via the Layout drop-down menu. Changing the normalization of flux from volume-specific flux to sample-specific flux or flow, or flux control ratios in the slope configuration window will also lead to a change of the layout but the calculation of the sample-specific flux in the marks statistics window is based on the previous layout. So if the previous layout was displaying the O2 slope negative, the calculated sample-specific flux will not be automatically background corrected. To obtain the background corrected specific flux or flux control rations in this case, it is needed to tick the background correction in the lower part of the slope configuration window. Background correction is especially critical when performing measurements in a high oxygen regime or using samples with a low respiratory flux or flow.
In addition, exported data include information contained in the Sample window, information contained in the O2 calibration window and on parameters used for Instrumental background oxygen flux correction.
- - [Flux/flow]: contains the information saved in the Mark information window and the values of flux or flow, according to the layout selected, corrected for Instrumental background oxygen flux. To obtain the background corrected sample-specific flux follow the instructions under [Flux/flow + all info].
- - [Slope uncorrected + all info] (default selection): contains the information saved in the Mark information window and the values of flux or flow, according to the layout selected. In addition, exported data include information contained in the Sample window, information contained in the O2 calibration window and on parameters used for Instrumental background oxygen flux correction.
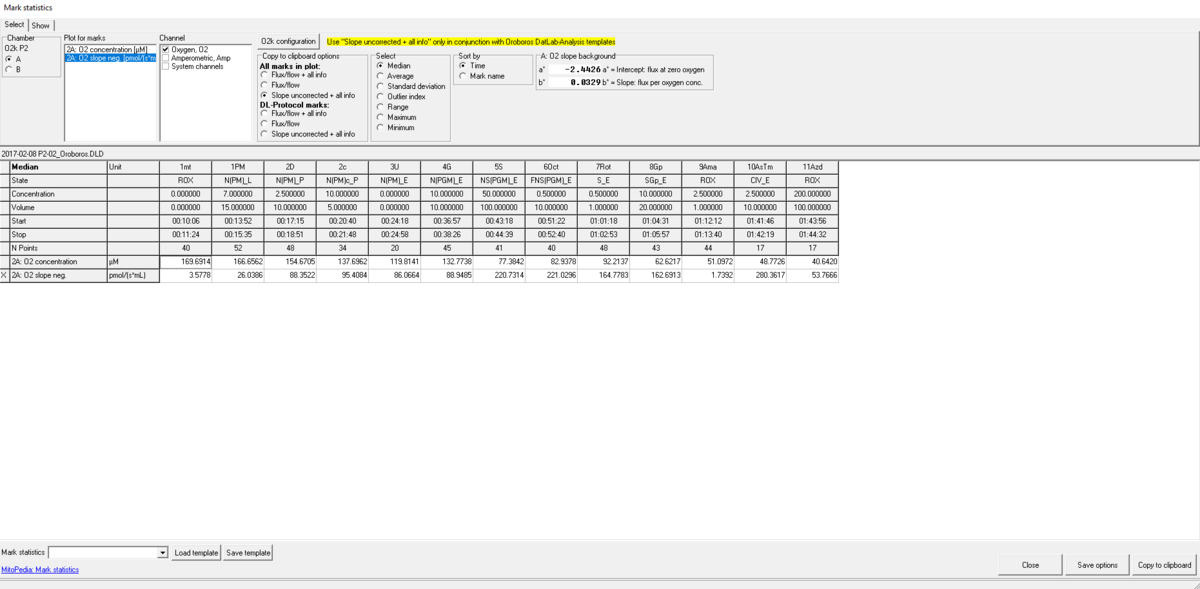
- A table is shown with all marks and their values.
- Select the O2k-chamber (A or B) for which plots should be displayed.
- Plot for marks: Select the source plot on which the relevant Marks are set.
- Channel selection: Select channels for which plots should be displayed in the mark statistics table.
- Copy to clipboard options: Select All marks in plot when a non-standard protocol and non-standard Mark names have been used for data acquisition. If data were recorded using a DL-protocol, DL-protocol marks can be selected along with the desired format for data display. For either selection, the previous chosen data display format can be changed again.
- Select how the displayed values are calculated over the sections defined by marks. Default: Median; other options: Average, Range, Maximum, Minimum.
- Sort by: If non-standard protocol and non-standard Mark names have been used, select the sequence of marks, sorted according to a time sequence (Time) or in alphanumerical order (Mark name). Values are displayed for all selected plots. The source plot for marks is indicated by an "X".
- Copy to clipboard to copy the table with or without 'Experimental details' to another programme/file (DatLab-Analysis templates). Open the target file (DatLab-Analysis templates and paste [Ctr-V] into the yellow cell for the subsample as indicated.
Results displayed in Mark statistics
- The plot selected for marks is labelled by an 'X' in the first column. The results for a mark set in the selected plot (a selected section) are shown for all selected channel types and for each plot in a channel. In the Mark statistics table above, the selected plot is '2A: O2 slope neg.', 'O2' is the only selected channel, and the results are shown for the plots '2A: O2 concentration' and '2A: O2 slope neg.'.
- In this setting, any marks defined on plot '2A: O2 concentration' are ignored.
- Select '2A: O2 concentration' as the primary plot to display results for all marks set on the plot '2A: O2 concentration'.
- This strategy allows to set marks and display results with specific focus on either the signal in a channel type (O2 concentration) or the time derivative (O2 slope). A mark set in one plot may partially overlap on the time scale with a mark set in another plot.
Keywords
- Bioblast links: Marks in DatLab - >>>>>>> - Click on [Expand] or [Collapse] - >>>>>>>
- Specific
- O2k-Procedures
- MiPNet O2k-Procedures
- » MiPNet26.06 DatLab 7: Guide - Section on setting Marks
- MiPNet O2k-Procedures
- General
MitoPedia O2k and high-resolution respirometry:
DatLab


