Difference between revisions of "Add Graph/Delete bottom graph"
From Bioblast
Beno Marija (talk | contribs) |
Beno Marija (talk | contribs) |
||
| Line 1: | Line 1: | ||
{{MitoPedia | {{MitoPedia | ||
|description= | |description=The active graph is selected by a left click into the graph. The active graph is highlighted and indicated by the Oroboros logo. | ||
The active graph is selected by a left click into the graph. The active graph is highlighted and indicated by the Oroboros logo. | |||
'''Add:''' A new graph is added at the bottom of the screen. Select plots for display in the new graph, Ctrl+F6 | '''Add:''' A new graph is added at the bottom of the screen. Select plots for display in the new graph, Ctrl+F6 | ||
| Line 8: | Line 7: | ||
|info= | |info= | ||
}} | }} | ||
[[File:Graph-menu.png|right|200px]] | |||
{{MitoPedia O2k and high-resolution respirometry | {{MitoPedia O2k and high-resolution respirometry | ||
|mitopedia O2k and high-resolution respirometry=DatLab | |mitopedia O2k and high-resolution respirometry=DatLab | ||
}} | }} | ||
Revision as of 14:52, 10 January 2018
- high-resolution terminology - matching measurements at high-resolution
Add Graph/Delete bottom graph
Description
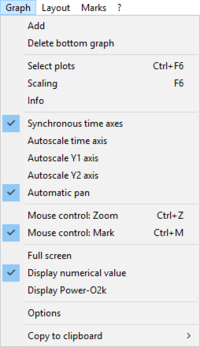
The active graph is selected by a left click into the graph. The active graph is highlighted and indicated by the Oroboros logo.
Add: A new graph is added at the bottom of the screen. Select plots for display in the new graph, Ctrl+F6
Delete: By clicking Delete bottom graph in the Graph-menu in DatLab, the bottom graph is deleted, which reappears with the same layout by Add.
MitoPedia O2k and high-resolution respirometry: DatLab

