Bugarski 2018 Am J Physiol Renal Physiol
| Bugarski M, Martins JR, Haenni D, Hall AM (2018) Multiphoton imaging reveals axial differences in metabolic autofluorescence signals along the kidney proximal tubule. Am J Physiol Renal Physiol 315:F1613-25. https://doi.org/10.1152/ajprenal.00165.2018 |
Bugarski M, Martins JR, Haenni D, Hall AM (2018) Am J Physiol Renal Physiol
Abstract: Kidney proximal tubules (PTs) are densely packed with mitochondria, and defects in mitochondrial function are implicated in many kidney diseases. However, little is known about intrinsic mitochondrial function within PT cells. Here, using intravital multiphoton microscopy and live slices of mouse kidney cortex, we show that autofluorescence signals provide important functional readouts of redox state and substrate metabolism and that there are striking axial differences in signals along the PT. Mitochondrial NAD(P)H intensity was similar in both PT segment (S)1 and S2 and was sensitive to changes in respiratory chain (RC) redox state, whereas cytosolic NAD(P)H intensity was significantly higher in S2. Mitochondrial NAD(P)H increased in response to lactate and butyrate but decreased in response to glutamine and glutamate. Cytosolic NAD(P)H was sensitive to lactate and pyruvate and decreased dramatically in S2 in response to inhibition of glucose metabolism. Mitochondrial flavoprotein (FP) intensity was markedly higher in S2 than in S1 but was insensitive to changes in RC redox state. Mitochondrial FP signal increased in response to palmitate but decreased in response to glutamine and glutamate. Fluorescence lifetime decays were similar in both S1 and S2, suggesting that intensity differences are explained by differences in abundance of the same molecular species. Expression levels of known fluorescent mitochondrial FPs were higher in S2 than S1. In summary, substantial metabolic information can be obtained in kidney tissue using a label-free live imaging approach, and our findings suggest that metabolism is tailored to the specialized functions of S1 and S2 PT segments.
• Bioblast editor: Gnaiger E
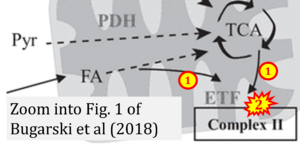
Correction: The TCA cycle does not feed electrons through ETF into CII, and ETF from FA does not feed electrons into CII but into CETFDH.
Correction: FADH2 and Complex II
- FADH2 is shown as the substrate feeding electrons into Complex II (CII). This is wrong and requires correction - for details see Gnaiger (2024).
- Gnaiger E (2024) Complex II ambiguities ― FADH2 in the electron transfer system. J Biol Chem 300:105470. https://doi.org/10.1016/j.jbc.2023.105470 - »Bioblast link«


