Uploads by Fasching Mario
From Bioblast
This special page shows all uploaded files.
| Date | Name | Thumbnail | Size | Description | Versions |
|---|---|---|---|---|---|
| 12:54, 16 March 2015 | MF686b A module calibration.png (file) |  |
19 KB | 1 | |
| 12:51, 16 March 2015 | MF686b A module DL.png (file) |  |
32 KB | 1 | |
| 15:40, 23 October 2014 | MiPNet14.05 App TPP-Mathematics-MembranePotential.pdf (file) | 436 KB | version 1 (2010) | 1 | |
| 09:43, 9 September 2014 | Usb to serial-device manager.PNG (file) |  |
20 KB | 1 | |
| 11:05, 27 August 2014 | O2k POS Connector SerieA-C.pdf (file) | 62 KB | 1 | ||
| 10:53, 27 August 2014 | Nullmodemkabel.pdf (file) | 24 KB | includes "working" "not working" statements | 2 | |
| 12:48, 10 April 2014 | Ca reading list.pdf (file) | 19 KB | 2 | ||
| 16:40, 11 March 2014 | TMRM 1mA Gain 1000.png (file) |  |
4 KB | MF567 stock 100 µM TIP: 5x 0.2 µl (5x10 nM), 5 x 1 µl (5 x 50 nM), 7 x 2 µl (7 x 100 nM) T=37°C Intervall 120 s light: left: 1 mA, gain: left 1000, DL: 2013-10-07 UV-01 | 1 |
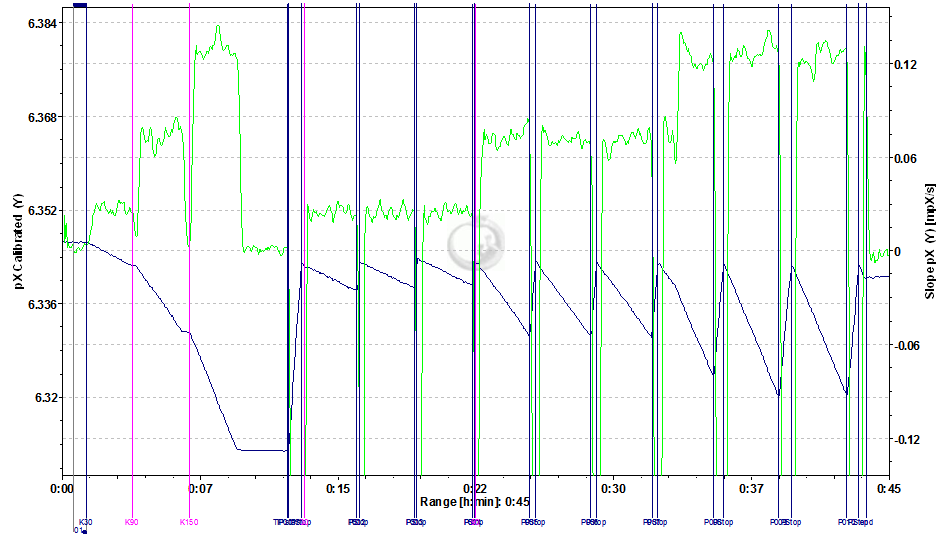
| 11:29, 3 January 2014 | PH PS demofile 6.png (file) |  |
27 KB | demo: calibration of buffering capacity with HCl (1 M), pH stat with KOH (100 mM): 1.) calibration steps (for calculating buffering capacity): 30, 90, 150 HCl pmol/ (ml s): TIP 1 mol/l Hcl, pump speed 0.06, 0.18, 0.3 µl/s 2.) simulated proton flow 30,9 | 1 |
| 09:33, 18 September 2013 | Drift vs light MitoOx2.png (file) |  |
38 KB | 1 | |
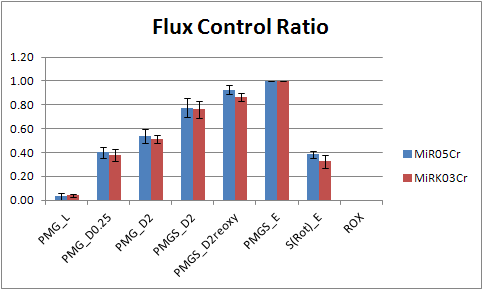
| 09:15, 18 September 2013 | Flux Control Ratio MiR05Cr vs MiRK03Cr.png (file) |  |
12 KB | 1 | |
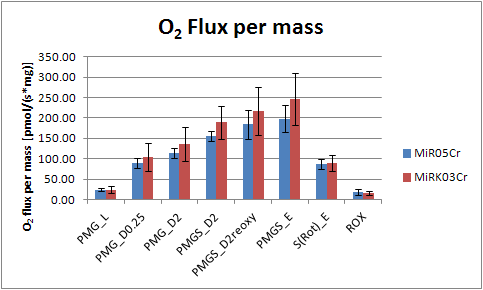
| 09:15, 18 September 2013 | O2 Flux per mass MiR05Cr vs MiRK03Cr.png (file) |  |
14 KB | 1 | |
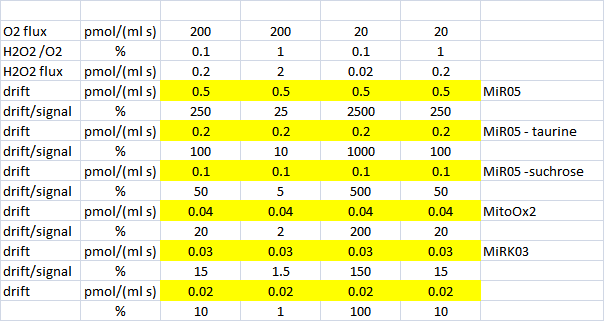
| 13:16, 17 September 2013 | Drift signal ratios.png (file) |  |
18 KB | 1 | |
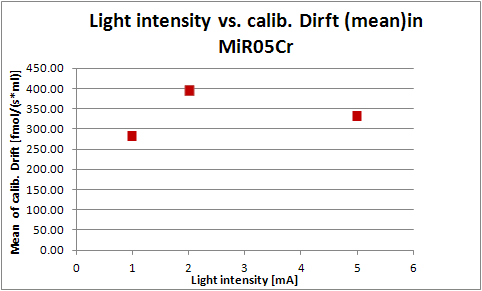
| 13:16, 17 September 2013 | Light int. vs. calib.drift in MiR05Cr.png (file) |  |
10 KB | 1 | |
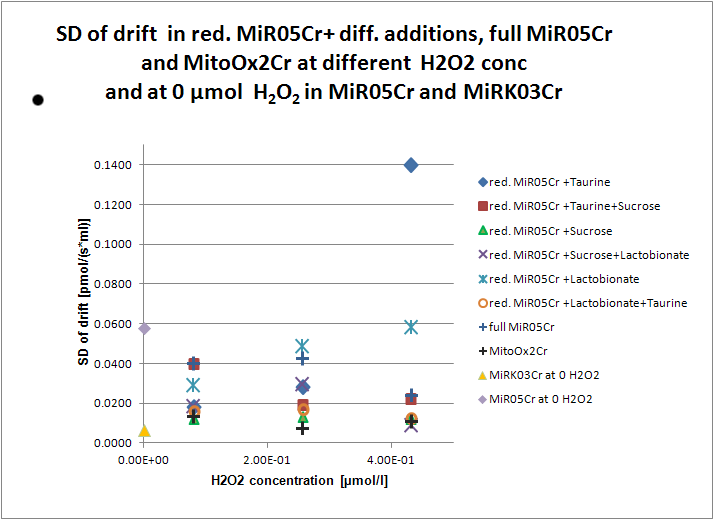
| 13:15, 17 September 2013 | SD drift at diff. H2O2 conc.png (file) |  |
31 KB | Reverted to version as of 11:10, 17 September 2013 | 3 |
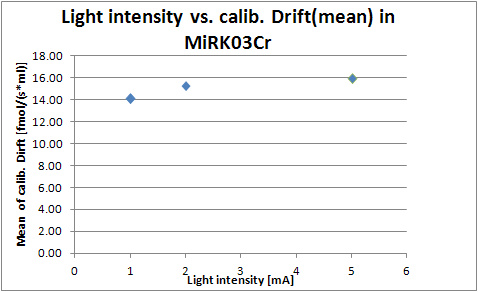
| 13:13, 17 September 2013 | Light int. vs.calib. drift in MiRK03Cr.png (file) |  |
11 KB | 2 | |
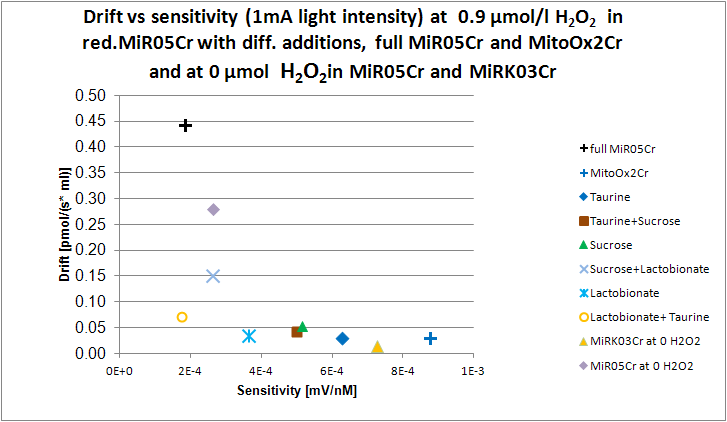
| 13:09, 17 September 2013 | Drift vs sensitivity.png (file) |  |
25 KB | 1 | |
| 12:30, 19 December 2012 | DL5 1 0 130 Amp calibration user settings.PNG (file) |  |
13 KB | 1 | |
| 11:54, 19 December 2012 | DL5 1 0 130 changing plot names.PNG (file) |  |
12 KB | 1 | |
| 14:26, 22 May 2012 | PX calib reset copy.PNG (file) |  |
14 KB | screen shot: PX_calib_reset_copy, reset button and copy from file button highlighted | 1 |
| 14:16, 22 May 2012 | O2kcontrol control pXgain.png (file) | 843 bytes | 1 | ||
| 14:11, 22 May 2012 | O2k config electrode numbers.jpg (file) |  |
14 KB | 1 | |
| 13:53, 22 May 2012 | Select plots pX.PNG (file) |  |
19 KB | Select plots windows with pX channels selected | 1 |
| 13:47, 22 May 2012 | Gain Serie C.jpg (file) |  |
17 KB | Setting the gain in Series A to C | 1 |
| 13:36, 22 May 2012 | MS connector electrodes.jpg (file) |  |
32 KB | 1 | |
| 13:34, 22 May 2012 | MS connector.jpg (file) |  |
30 KB | MS_connector connected to oxygraph, no electrodes | 1 |
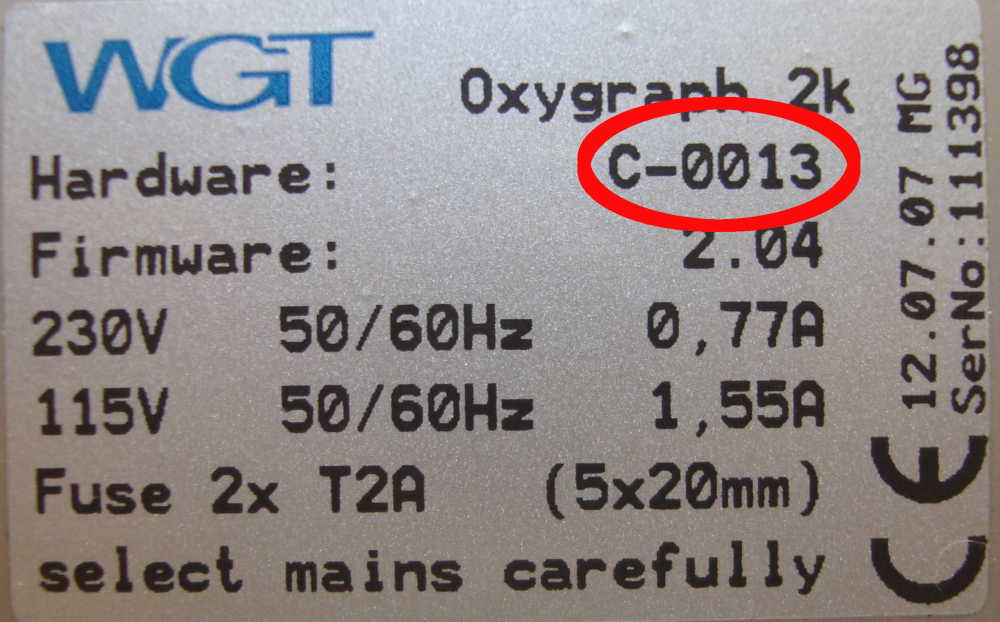
| 10:58, 22 May 2012 | Serial number sticker small.JPG (file) |  |
74 KB | how to find the serial number of an O2k: off-line, sticker, rear of oxygraph | 1 |
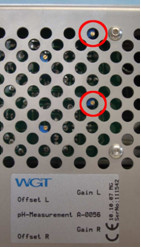
| 10:57, 22 May 2012 | Serial number signal line.png (file) | 2 KB | how to find the serial number of an O2k: on-line, signal line | 1 | |
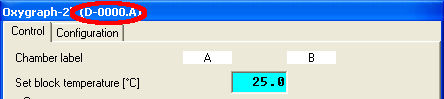
| 10:56, 22 May 2012 | Serial number control window.png (file) | 4 KB | how to find the serial number of an O2k: on-line, control window | 1 | |
| 15:25, 14 May 2012 | USB RS232.PNG (file) |  |
4 KB | O2k connect selection RS232 / USB | 1 |
| 14:35, 14 May 2012 | Series E Rear USB web.JPG (file) |  |
29 KB | 1 | |
| 13:36, 9 May 2012 | DL5 control Amp.png (file) |  |
7 KB | DL5 screen shot P2k control window Amp | 1 |
| 13:19, 9 May 2012 | DL5 Amp multpoint calib.PNG (file) |  |
17 KB | DL5 screenshot multiple point calibration in spreadsheet program, followed by setting calibration values by importing "data matrix" | 1 |
| 13:04, 9 May 2012 | DL5 Amp 2point calib.PNG (file) |  |
20 KB | DL5 screen shot Amp 2 point calibration | 1 |
| 11:19, 9 May 2012 | DL5 graph select plots amp.PNG (file) |  |
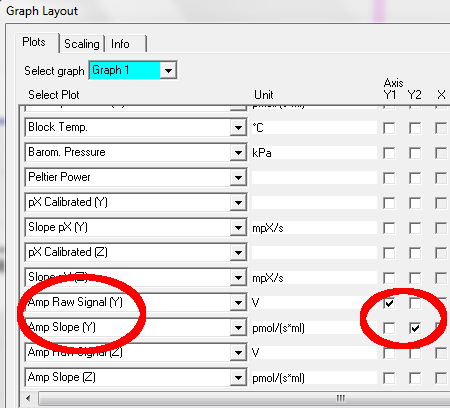
13 KB | DL5 sreen shot: Graph/select plots Amp raw signal selected | 1 |
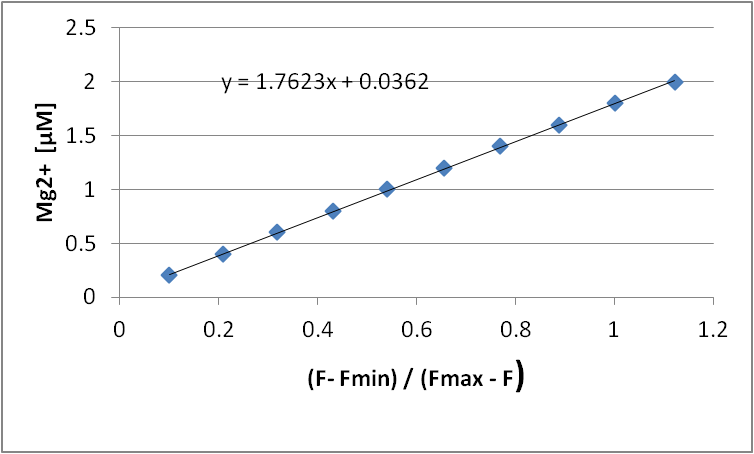
| 13:20, 26 March 2012 | Mg green checkpoints.jpg (file) |  |
45 KB | Use of Magnesium Green 5N hexapotassium salt to measure ADP-ATP exchange rates: checkpoints | 1 |
| 13:42, 7 October 2011 | K-Regio Icon.jpg (file) | 232 KB | 1 | ||
| 13:39, 7 October 2011 | K-Regio Icon Englisch 01.jpg (file) | 202 KB | 1 | ||
| 13:58, 8 February 2011 | Homogenate brain centrifuged Kout.png (file) |  |
19 KB | for Pmt = 0.218 mg | 2 |
| 13:25, 8 February 2011 | Homogenate brain centrifuged Pmt.png (file) |  |
19 KB | Psi values and one delta delta Psi values plotted against varying amount of mitochondrial protein Pmt; brain homogenate, centrifuged | 1 |
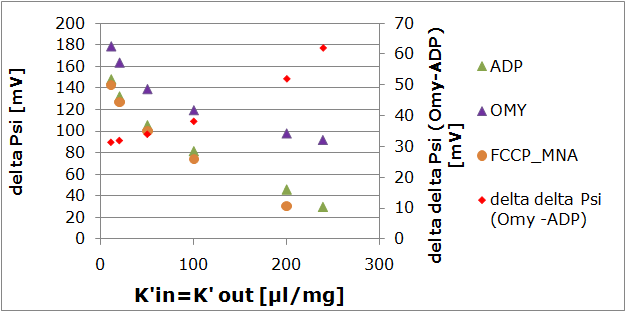
| 17:44, 12 January 2011 | Isolated mito KinandKout variation.png (file) |  |
20 KB | show full legend | 2 |
| 17:39, 12 January 2011 | Isolated mito Kout variation.png (file) |  |
23 KB | Reverted to version as of 15:36, 12 January 2011 | 3 |
| 16:18, 12 January 2011 | Homogenate brain crude Kout.png (file) |  |
21 KB | Delta Psi plotted against Kout (Kin=11) Brain homogenate crude | 1 |
| 15:33, 7 January 2011 | Homogenate brain centrifuged Koutand Kin.png (file) |  |
19 KB | Homogenate,brain,centrifuged variation of Kout and Kin | 1 |
| 13:04, 7 January 2011 | Error evaluation absolute 1pc.png (file) |  |
14 KB | 2 |