Difference between revisions of "Talk:Magnesium Green"
| Line 44: | Line 44: | ||
[[User:Fasching Mario|Fasching Mario]] 12:02, 16 March 2015 (CET) | [[User:Fasching Mario|Fasching Mario]] 12:02, 16 March 2015 (CET) | ||
Revision as of 13:12, 16 March 2015
Mg green concentrations
used by OROBOROS for testing: stock: 2 mM in chamber: 2 µM
Mg2+ calibration experiment
The following calibration experiment was performed with a medium contaminated with Ca2+. Ca2+ impurities are a particular problem because a.) Mg green binds stronger to Ca2+ than to Mg2+ and b.) Ca2+ impurities are very common. The Ca2+ impurities were complexed by an EGTA titration before the Mg2+ calibration, without (in this case) negative effects on the Mg2+ performance.
- O2k with O2k-Fluo LED2-Module, Fluorescence-Sensor Blue, and Filter Set MgG / CaG
- LED intensity: Amp polarisation voltage = 100 mV, Amp Gain = 1000, data sampling interval = 2 s, 37°C
- medium: as described by C Chinopoulos, see main article page for references.
Titrations:
- Mg green 2 µL 2 mM --> 2 µM
- EGTA titration: 3 * (5 µl 20 mM --> 50 µM) until very small changes in signal
- DTPA 2 µl 20 mM -->20 µM
- 10 * ( 4 µl MgCl2 0.1 M --> 0.2 mM)
- EDTA 16 µl 500 mM --> 4 mM
- EDTA 2 µl 500 mM --> 0.5 mM: no further change
- MgCl2 80 µl 1 M --> 40 mM
- MgCl2 20 µl 1 M --> 10 mM: no further change
(To allow performance tests a substance mimicking light scattering of typical samples was added to the medium, however this is not relevant for the results presented here.)
The addition of a very small concentration of either EDTA or DTPA in the beginning of the experiment is suggested by the produced of the fluorophores (for all similar fluorophores) to remove traces of transition metal cations.
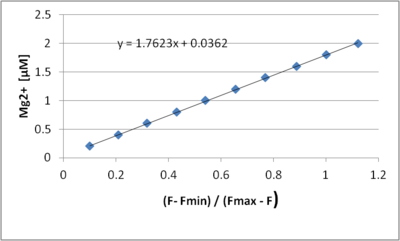
Shown in the DatLab graph is the original raw voltage as recoded by the fluorescence sensor and the Mg2+ concentration. For calibration determining KD and slope) and plotting the calculated Mg concentration (via the experimental scripting function of DatLab) the following relation was used
[Mg2+] = Kd * ( F- Fmin) / (Fmac -F) + intercept
with
F .......Fluorescence signal Fmin..... minimal fluorescence signal, free Mg2+ concentration = 0, established by excess EDTA Fmax .....maximal fluorescence signal, fluorophore indicator saturated with Mg2+, established by excess of MgCl2
The determined KD value (1.8 mM) is influenced by the presence of both Ca2+ and EGTA. However, by using the the determined KD value the linearity of the calculated Mg2+ concentration is still very good. Both, free EGTA and free Ca2+, concentrations that are significantly higher than the smallest Mg2+ but significantly lower than the highest Mg2+ concentration will however affect the apparent linearity. Therefore a medium that is as Ca2+ free possible should be used as a matter of principle, even if this example shows that good results may be be obtained even in the presence of heavy Ca2+ contamination.
Fasching Mario 12:02, 16 March 2015 (CET)

