Difference between revisions of "Body mass excess"
| Line 8: | Line 8: | ||
__TOC__ | __TOC__ | ||
== Body mass excess in relation to the allometry of the healthy reference population == | == Body mass excess in relation to the allometry of the healthy reference population == | ||
''Work in progress'' by [[Gnaiger E]] 2020-02- | ''Work in progress'' by [[Gnaiger E]] 2020-02-10 linked to a preprint in preparation on [[body mass excess |'''BME''']] and [[:Category:BME and mitObesity |'''mitObesity''']]. | ||
:::: The [[body mass index]], BMI = ''M''·''H''<sup>-2</sup> [kg·m<sup>-2</sup>], is a globally applied metric for evaluation of undernutrition or overweight and obesity ([[NCD-RisC 2017 Lancet]]). The WHO recommends the use of BMI cutoff points of 25 and 30 kg·m<sup>-2</sup> for categorization of overweight and obese states in adults world-wide ([[WHO Expert Consultation 2004 Lancet]]), despite of critical assessments of the need to adjust BMI cutoffs to lower values in Asian populations and differentiate BMI cutoff values for women and men ([[WHO 2000 Sydney Health Comm AU]]; [[Nevill 2015 Nutr Diabetes]]; [[Mialich 2018 J Electr Bioimp]]). | :::: The [[body mass index]], BMI = ''M''·''H''<sup>-2</sup> [kg·m<sup>-2</sup>], is a globally applied metric for evaluation of undernutrition or overweight and obesity ([[NCD-RisC 2017 Lancet]]). The WHO recommends the use of BMI cutoff points of 25 and 30 kg·m<sup>-2</sup> for categorization of overweight and obese states in adults world-wide ([[WHO Expert Consultation 2004 Lancet]]), despite of critical assessments of the need to adjust BMI cutoffs to lower values in Asian populations and differentiate BMI cutoff values for women and men ([[WHO 2000 Sydney Health Comm AU]]; [[Nevill 2015 Nutr Diabetes]]; [[Mialich 2018 J Electr Bioimp]]). | ||
| Line 46: | Line 46: | ||
::::## The expected '''maximum aerobic exercise capacity''' per body mass, ''V''<sub>O<small>2</small>max/''M''</sub>, at a BME of 0.1 is 55 mL·min<sup>-1</sup>·kg<sup>-1</sup>. The calculated ''V''<sub>O<small>2</small>max/''M''</sub> applies to healthy adults, and does not apply to BME<0. | ::::## The expected '''maximum aerobic exercise capacity''' per body mass, ''V''<sub>O<small>2</small>max/''M''</sub>, at a BME of 0.1 is 55 mL·min<sup>-1</sup>·kg<sup>-1</sup>. The calculated ''V''<sub>O<small>2</small>max/''M''</sub> applies to healthy adults, and does not apply to BME<0. | ||
::::## At BME=0.0, the '''reference body mass, ''M''°''', is calculated from your height and shows the corresponding body mass of a person from the healthy reference population. Example '''''M''°=57.7 kg/x''': Compare your measured body mass of 63.4 kg/x with the reference body mass of 57.7 kg/x. | ::::## At BME=0.0, the '''reference body mass, ''M''°''', is calculated from your height and shows the corresponding body mass of a person from the healthy reference population. Example '''''M''°=57.7 kg/x''': Compare your measured body mass of 63.4 kg/x with the reference body mass of 57.7 kg/x. | ||
::::## At BME=0.2 and 0.4, the '''overweight body mass, 1.2''M''°''', and '''obese body mass, 1.4''M''°''', are calculated from the reference body mass. You can compare these cutoff values with your actual body mass. Example '''1.2''M''°=69.2 kg/x''': More than 69.2 kg/x is rated as overweight for a height of 1.70 m with BME=0.2. '''1.4''M''°=80.8 kg/x''': More than 80.8 kg/x is rated as obese for a height of 1.70 m with BME=0.4. | ::::## At BME=0.2 and 0.4, the '''overweight body mass, 1.2''M''°''', and '''obese body mass, 1.4''M''°''', are calculated from the reference body mass. You can compare these cutoff values with your actual body mass. Example '''1.2''M''°=69.2 kg/x''': More than 69.2 kg/x is rated as overweight for a height of 1.70 m/x with BME=0.2. '''1.4''M''°=80.8 kg/x''': More than 80.8 kg/x is rated as obese for a height of 1.70 m/x with BME=0.4. | ||
::::* If you want to edit the height or body mass entered above, click into the corresponding field, delete the previously entered number, enter the new number, and click into the field '''Click here for results'''. | ::::* If you want to edit the height or body mass entered above, click into the corresponding field, delete the previously entered number, enter the new number, and click into the field '''Click here for results'''. | ||
| Line 60: | Line 60: | ||
::::* The concept of BME is related to maximum ergometric capacity and mitochondrial fitness ([[Gnaiger 2019 MiP2019]]). | ::::* The concept of BME is related to maximum ergometric capacity and mitochondrial fitness ([[Gnaiger 2019 MiP2019]]). | ||
::::* For 0.45 to 1.26 m | ::::* For heights of 0.45 to 1.26 m per newborn or child, the tables are based on data for WHO Child Growth Standards (WHO MGRS: [[WHO 2006 Acta Paediatr]]; [[WHO 2006 Geneva: World Health Organization]]) compiled from Brazil, Ghana, India, Norway, Oman and the USA, reporting as little as 3 % differences between these groups studied in affluent neighborhoods and ''raised in environments that do not constrain growth'' ([[WHO 2006 Acta Paediatr]]). At the same height the body mass of girls and boys differs less than ±2 % from the common fitted curve, except for a difference of +3 % for boys at 0.70 to 0.77 m/x and -3 % for girls at 0.62 to 0.64 m/x. | ||
::::* For heights of 1.27 m and above, the tables are based on the Committee on Biological Handbooks data set (CBH; [[Zucker 1962 Committee on Biological Handbooks, Fed Amer Soc Exp Biol]]), compiled from publications between 1931 to 1944 ([[Healthy reference population]]). These agree with WHO | ::::* For heights of 1.27 m/x and above, the tables are based on the Committee on Biological Handbooks data set (CBH; [[Zucker 1962 Committee on Biological Handbooks, Fed Amer Soc Exp Biol]]), compiled from publications between 1931 to 1944 ([[Healthy reference population]]). These agree with WHO-CGS data at heights 1.27 to 1.4 m per child or adolescent ([[WHO 2006 Geneva: World Health Organization]]) within better than 2 %, and agree on noting no difference in the curves for females and males, but adult females do not reach the same height as males. Body mass and height are not different in girls and boys at the corresponding age of 8 to 10 years. | ||
==== BME at height 0.45 - 0.62 m ==== | ==== BME at height 0.45 - 0.62 m/x ==== | ||
:::::::: Based on WHO MGRS: ''M''° = 28.60·''H''<sup>3.086</sup> | :::::::: Based on WHO MGRS: ''M''° = 28.60·''H''<sup>3.086</sup> | ||
:::: [[File:BME 0.45-0.62.png|800px]] | :::: [[File:BME 0.45-0.62.png|800px]] | ||
==== BME at height 0.63 - 1.02 m ==== | ==== BME at height 0.63 - 1.02 m/x ==== | ||
:::::::: Based on WHO MGRS: ''M''° = 15.08·''H''<sup>1.704</sup> | :::::::: Based on WHO MGRS: ''M''° = 15.08·''H''<sup>1.704</sup> | ||
:::: [[File:BME 0.63-1.02.png|800px]] | :::: [[File:BME 0.63-1.02.png|800px]] | ||
==== BME at height 1.03 - 1.26 m ==== | ==== BME at height 1.03 - 1.26 m/x ==== | ||
:::::::: Based on WHO MGRS: ''M''° = 14.89·''H''<sup>2.178</sup> | :::::::: Based on WHO MGRS: ''M''° = 14.89·''H''<sup>2.178</sup> | ||
:::: [[File:BME 1.03-1.26.png|800px]] | :::: [[File:BME 1.03-1.26.png|800px]] | ||
==== BME at height 1.27 - 2.0 m ==== | ==== BME at height 1.27 - 2.0 m/x ==== | ||
:::::::: Based on Biological Handbooks ([[Zucker 1962 Committee on Biological Handbooks, Fed Amer Soc Exp Biol]]), extrapolated >1.8 m: ''M''° = 12.68·''H''<sup>2.857</sup> | :::::::: Based on Biological Handbooks ([[Zucker 1962 Committee on Biological Handbooks, Fed Amer Soc Exp Biol]]), extrapolated >1.8 m: ''M''° = 12.68·''H''<sup>2.857</sup> | ||
:::::::: The circled numbers emphasize the precision-BMI cutoff points used for harmonization between BME cutoff points and conventional BMI cutoff values, at 1.70 m for the normal BMI of 20 kg·m<sup>-2</sup>, at 1.79 m for the overweight BMI of 25 kg·m<sup>-2</sup>, and at 1.84 m for the obese BMI of 30 kg·m<sup>-2</sup>. | :::::::: The circled numbers emphasize the precision-BMI cutoff points used for harmonization between BME cutoff points and conventional BMI cutoff values, at 1.70 m/x for the normal BMI of 20 kg·m<sup>-2</sup>, at 1.79 m/x for the overweight BMI of 25 kg·m<sup>-2</sup>, and at 1.84 m/x for the obese BMI of 30 kg·m<sup>-2</sup>. | ||
:::: [[File:BME 1.27-1.6.png|800px]] | :::: [[File:BME 1.27-1.6.png|800px]] | ||
Revision as of 23:55, 10 February 2020

- high-resolution terminology - matching measurements at high-resolution
Body mass excess
Description
The body mass excess, BME, is an index of obesity and as such BME is a lifestyle metric. The BME with respect to the healthy reference population, HRP, is defined as BME ≝ ΔM/M°. ΔM is the excess body mass exceeding the reference body mass, M°, in the HRP. Thus the BME is a measure of the extent to which your actual body mass, M [kg/x], deviates from M° [kg/x], which is the reference body mass [kg] per individual [x] without excess body fat. The BME is expressed relative to the reference body mass for your height, H [m]. A balanced BME is BME° = 0.0 with a band width of -0.1 towards underweight and +0.2 towards overweight. The BME is linearly related to the body fat excess.
Abbreviation: BME
Reference: Gnaiger 2019 MiP2019
| Healthy reference population | Body mass excess | BFE | BME cutoffs | BMI | H | M | VO2max | mitObesity drugs |
Body mass excess in relation to the allometry of the healthy reference population
Work in progress by Gnaiger E 2020-02-10 linked to a preprint in preparation on BME and mitObesity.
- The body mass index, BMI = M·H-2 [kg·m-2], is a globally applied metric for evaluation of undernutrition or overweight and obesity (NCD-RisC 2017 Lancet). The WHO recommends the use of BMI cutoff points of 25 and 30 kg·m-2 for categorization of overweight and obese states in adults world-wide (WHO Expert Consultation 2004 Lancet), despite of critical assessments of the need to adjust BMI cutoffs to lower values in Asian populations and differentiate BMI cutoff values for women and men (WHO 2000 Sydney Health Comm AU; Nevill 2015 Nutr Diabetes; Mialich 2018 J Electr Bioimp).

- The unequivocal agreement on adjusting BMI cutoffs for children (Cole 2000 BMJ; De Onis 2019 Public Health Nutrition) provides solid proof that body mass does not generally scale with height squared in a healthy reference population, HRP.
- The body mass excess, BME, is an index of the relative deviation of the actual body mass, M [kg], from the reference body mass, M° [kg], at a given height in the healthy reference population (Fig. 1),
Eq. 1: BME = (M-M°)/M°
- In contrast to the BMI, therefore, the BME provides an evidence-based index of underweight, overweight and obesity across all heights and ages, applicable to all populations for which the healthy reference baseline is established.
BME - the body mass excess calculator
Note: BME is now defined as ΔM/M° = (M-M°)/M° = M/M°-1, in contrast to our previous definition as M/M°.
» BME calculator
Erich Gnaiger and Paolo Cocco - last update 2020-01-07
- Example: BME and precision-BMI cutoff points
- Considering a height of 1.78 m, the balanced body mass is M° = 65.9 kg per individual, and overweight is reached at a weight gain of 20 % or BME = 0.2: (1+0.2)·M° = 79 kg per individual. The corresponding precision-BMI cutoff poin for overweight is BMI0.2 = 65.9/1.782 = 24.9 kg/m2.
- At a height of 1.84 m, the balanced body mass is M° = 72.4 kg/x, and obesity is reached at a weight gain of 40 % or BME = 0.4. 1.4·M° = 101.4 kg/x. The corresponding precision-BMI cutoff poin for obese is BMI0.4 = 72.4/1.842 = 29.9 kg/m2.
- The BME calculator
- The BME calculator is based on the WHO database on children up to 10 years of age (WHO Multicentre Growth Reference Study Group, WHO MGRS 2006), and on the Committee on Biological Handbooks data set (CBH; Zimmer 1962) on adoselscents to adults (Fig. 1), according to the tables listed below. The results have to be critically evaluated. The BME calculator applies to healthy controls (except for obesity), without sarcopenia.
- Open the BME calculator by clicking here (press Ctrl and left mouse click): BME calculator
- Click into the field Height, H [m], and enter your height in meters [m] (not cm), using the dot (not the comma) as a separator for two decimal places. Do not enter more than two decimal places. Example: 1.70 m
- Click into the field Body mass, M [kg/x], and enter your mass (weight) in kilograms [kg] (not pounds), using the dot (not the comma) as a separator for the decimal place. Example: 63.4 kg/x
- Click into the field Click here for results. This activates the caclulator. Results are displayed in the fields below.
- The body mass excess, BME, is calculated from your height and body mass. Example BME=0.1: With a BME of 0.1 you are 10 % above the reference body mass, which is well within the normal range. The percentage is calculated as BME*100.
- For comparison with the commonly used Body mass index, BMI [kg/m2], the BMI is calculated from your body mass divided by your height squared. Example BMI=21.9 kg/m2: What does this index tell you?
- The expected maximum aerobic exercise capacity per body mass, VO2max/M, at a BME of 0.1 is 55 mL·min-1·kg-1. The calculated VO2max/M applies to healthy adults, and does not apply to BME<0.
- At BME=0.0, the reference body mass, M°, is calculated from your height and shows the corresponding body mass of a person from the healthy reference population. Example M°=57.7 kg/x: Compare your measured body mass of 63.4 kg/x with the reference body mass of 57.7 kg/x.
- At BME=0.2 and 0.4, the overweight body mass, 1.2M°, and obese body mass, 1.4M°, are calculated from the reference body mass. You can compare these cutoff values with your actual body mass. Example 1.2M°=69.2 kg/x: More than 69.2 kg/x is rated as overweight for a height of 1.70 m/x with BME=0.2. 1.4M°=80.8 kg/x: More than 80.8 kg/x is rated as obese for a height of 1.70 m/x with BME=0.4.
- If you want to edit the height or body mass entered above, click into the corresponding field, delete the previously entered number, enter the new number, and click into the field Click here for results.
- Height of humans is measured with a wall-mounted statiometer.
- The body mass is measured on a calibrated balance in light underware without shoes.
Body mass excess (BME) compared to body mass index (BMI)
- Balanced standard: BME = 0.0
- Overweight: BME > 0.2
- Obese: BME > 0.4
- The concept of BME is related to maximum ergometric capacity and mitochondrial fitness (Gnaiger 2019 MiP2019).
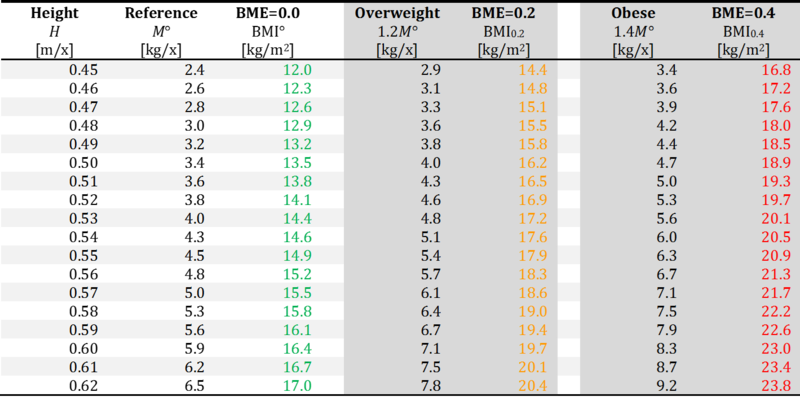
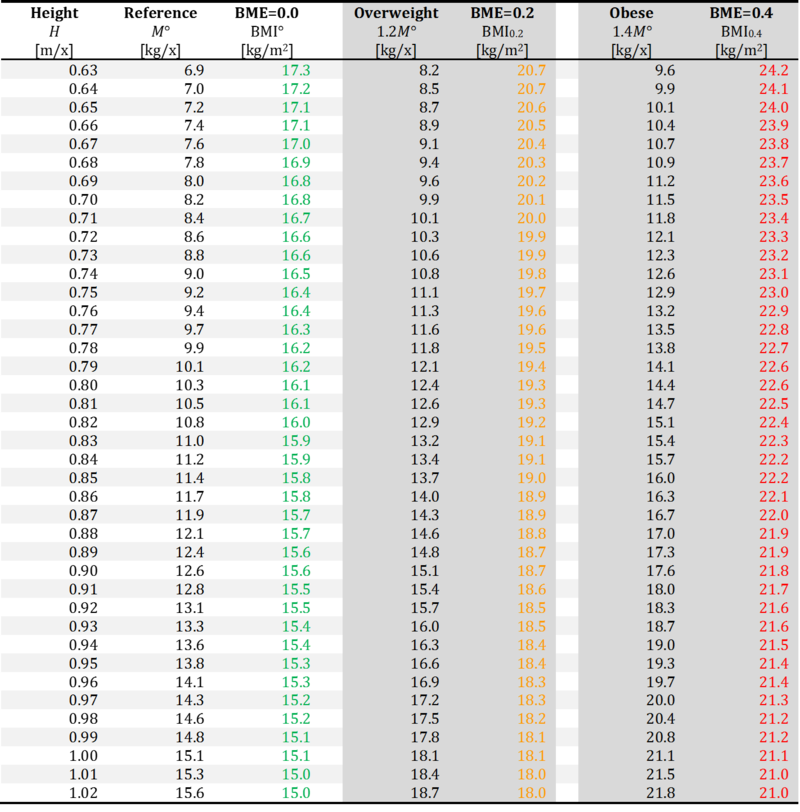
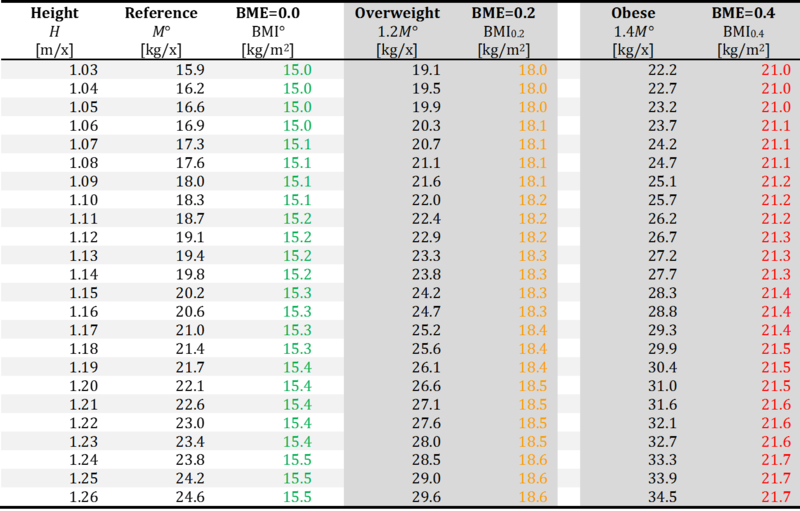
- For heights of 0.45 to 1.26 m per newborn or child, the tables are based on data for WHO Child Growth Standards (WHO MGRS: WHO 2006 Acta Paediatr; WHO 2006 Geneva: World Health Organization) compiled from Brazil, Ghana, India, Norway, Oman and the USA, reporting as little as 3 % differences between these groups studied in affluent neighborhoods and raised in environments that do not constrain growth (WHO 2006 Acta Paediatr). At the same height the body mass of girls and boys differs less than ±2 % from the common fitted curve, except for a difference of +3 % for boys at 0.70 to 0.77 m/x and -3 % for girls at 0.62 to 0.64 m/x.
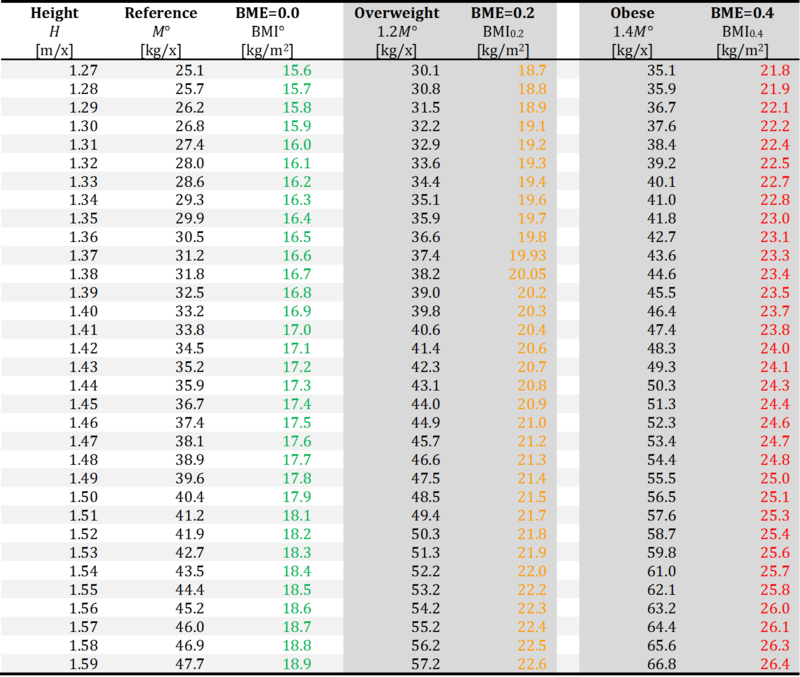
- For heights of 1.27 m/x and above, the tables are based on the Committee on Biological Handbooks data set (CBH; Zucker 1962 Committee on Biological Handbooks, Fed Amer Soc Exp Biol), compiled from publications between 1931 to 1944 (Healthy reference population). These agree with WHO-CGS data at heights 1.27 to 1.4 m per child or adolescent (WHO 2006 Geneva: World Health Organization) within better than 2 %, and agree on noting no difference in the curves for females and males, but adult females do not reach the same height as males. Body mass and height are not different in girls and boys at the corresponding age of 8 to 10 years.
BME at height 0.45 - 0.62 m/x
- Based on WHO MGRS: M° = 28.60·H3.086

BME at height 0.63 - 1.02 m/x
- Based on WHO MGRS: M° = 15.08·H1.704

BME at height 1.03 - 1.26 m/x
- Based on WHO MGRS: M° = 14.89·H2.178

BME at height 1.27 - 2.0 m/x
- Based on Biological Handbooks (Zucker 1962 Committee on Biological Handbooks, Fed Amer Soc Exp Biol), extrapolated >1.8 m: M° = 12.68·H2.857
- The circled numbers emphasize the precision-BMI cutoff points used for harmonization between BME cutoff points and conventional BMI cutoff values, at 1.70 m/x for the normal BMI of 20 kg·m-2, at 1.79 m/x for the overweight BMI of 25 kg·m-2, and at 1.84 m/x for the obese BMI of 30 kg·m-2.


References BME
Sort in ascending/descending order by a click on one of the small symbols in squares below.
Default sorting: chronological. Empty fields appear first in ascending order.
| Year | Reference | Organism | Tissue;cell | Stress | Diseases | |
|---|---|---|---|---|---|---|
| National Academies of Sciences, Engineering, and Medicine 2024 Body composition and obesity | 2024 | National Academies of Sciences, Engineering, and Medicine (2024) Exploring the science on measures of body composition, body fat distribution, and obesity. National Academies Press, Washington, DC https://doi.org/10.17226/27461. | Human | Fat | Obesity | |
| National Academies of Sciences, Engineering, and Medicine 2023 BMI and beyond | 2023 | National Academies of Sciences, Engineering, and Medicine (2023) BMI and beyond: Considering context in measuring obesity and its applications: Proceedings of a workshop—in brief. The National Academies Press, Washington, DC. https://doi.org/10.17226/27185 | Human | Fat | Obesity | |
| Chambers 2020 J Appl Physiol (1985) | 2020 | Chambers TL, Burnett TR, Raue U, Lee GA, Finch WH, Graham BM, Trappe TA, Trappe S (2020) Skeletal muscle size, function, and adiposity with lifelong aerobic exercise. J Appl Physiol (1985) 128:368–78. | Human | Skeletal muscle Fat | Aging;senescence | |
| Hood 2019 Nutr Diabetes | 2019 | Hood K, Ashcraft J, Watts K, Hong S, Choi W, Heymsfield SB, Gautam RK, Thomas D (2019) Allometric scaling of weight to height and resulting body mass index thresholds in two Asian populations. Nutr Diabetes 9:2. doi: 10.1038/s41387-018-0068-3. | Human | Obesity | ||
| Misra 2019 J Postgrad Med | 2019 | Misra P, Singh AK, Archana S, Lohiya A, Kant S (2019) Relationship between body mass index and percentage of body fat, estimated by bio-electrical impedance among adult females in a rural community of North India: A cross-sectional study. J Postgrad Med 65:134-40. | Human | Fat | Obesity | |
| Mialich 2018 J Electr Bioimp | 2018 | Mialich MS, Silva BR, Jordao AA (2018) Cutoff points of BMI for classification of nutritional status using bioelectrical impedance analysis. J Electr Bioimp 9:24-30. | Human | Fat | Obesity | |
| Wollner 2017 J Public Health Res | 2017 | Wollner M, Paulo Roberto BB, Alysson Roncally SC, Jurandir N, Edil LS (2017) Accuracy of the WHO's body mass index cut-off points to measure gender- and age-specific obesity in middle-aged adults living in the city of Rio de Janeiro, Brazil. J Public Health Res 6:904. | Human | Fat | Obesity | |
| NCD-RisC 2017 Lancet | 2017 | NCD Risk Factor Collaboration (NCD-RisC) (2017) Worldwide trends in body-mass index, underweight, overweight, and obesity from 1975 to 2016: a pooled analysis of 2416 population-based measurement studies in 128·9 million children, adolescents, and adults. Lancet 390:2627–42. | Human | Obesity | ||
| Distefano 2016 J Gerontol A Biol Sci Med Sci | 2016 | Distefano G, Standley RA, Dubé JJ, Carnero EA, Ritov VB, Stefanovic-Racic M, Toledo FG, Piva SR, Goodpaster BH, Coen PM (2016) Chronological age does not influence ex-vivo mitochondrial respiration and quality control in skeletal muscle. J Gerontol A Biol Sci Med Sci 72:535-42. | Human | Skeletal muscle | Aging;senescence | |
| Korre 2016 Am J Cardiol | 2016 | Korre M, Porto LG, Farioli A, Yang J, Christiani DC, Christophi CA, Lombardi DA, Kovacs RJ, Mastouri R, Abbasi S, Steigner M, Moffatt S, Smith D, Kales SN (2016) Effect of body mass index on left ventricular mass in career male firefighters. Am J Cardiol 118:1769-1773. | Human | Heart | Cardiovascular Obesity | |
| Indian Academy of Pediatrics Growth Charts Committee 2015 Indian Pediatr | 2015 | Indian Academy of Pediatrics Growth Charts Committee, Khadilkar V, Yadav S, Agrawal KK, Tamboli S, Banerjee M, Cherian A, Goyal JP, Khadilkar A, Kumaravel V, Mohan V, Narayanappa D, Ray I, Yewale V (2015) Revised IAP growth charts for height, weight and body mass index for 5- to 18-year-old Indian children. Indian Pediatr 52:47-55. | Human | Aging;senescence Obesity | ||
| Gnaiger 2015 Scand J Med Sci Sports | 2015 | Gnaiger E, Boushel R, Søndergaard H, Munch-Andersen T, Damsgaard R, Hagen C, Díez-Sánchez C, Ara I, Wright-Paradis C, Schrauwen P, Hesselink M, Calbet JAL, Christiansen M, Helge JW, Saltin B (2015) Mitochondrial coupling and capacity of oxidative phosphorylation in skeletal muscle of Inuit and caucasians in the arctic winter. https://doi.org/10.1111/sms.12612 | Human | Skeletal muscle | Temperature | |
| Mialich 2014 Nutr Hosp | 2014 | Mialich MS, Martinez EZ, Jordao JJ (2014) Application of body mass index adjusted for fat mass (BMIfat) obtained by bioelectrical impedance in adults. Nutr Hosp 30:417-24. | Human | Fat | Obesity | |
| Loe 2013 PLOS ONE | 2013 | Loe H, Rognmo Ø, Saltin B, Wisløff U (2013) Aerobic capacity reference data in 3816 healthy men and women 20-90 years. PLOS ONE 8:e64319. | Human | |||
| Andersen 2013 Int J Circumpolar Health | 2013 | Andersen S, Fleischer Rex K, Noahsen P, Sørensen HC, Mulvad G, Laurberg P (2013) Raised BMI cut-off for overweight in Greenland Inuit--a review. Int J Circumpolar Health 2013 Aug 5;72. doi: 10.3402/ijch.v72i0.21086. | Obesity | |||
| Pesta 2011 Am J Physiol Regul Integr Comp Physiol | 2011 | Pesta D, Hoppel F, Macek C, Messner H, Faulhaber M, Kobel C, Parson W, Burtscher M, Schocke M, Gnaiger E (2011) Similar qualitative and quantitative changes of mitochondrial respiration following strength and endurance training in normoxia and hypoxia in sedentary humans. Am J Physiol Regul Integr Comp Physiol 301:R1078–87. | Human | Skeletal muscle | Hypoxia | Obesity |
| Meeuwsen 2010 Clin Nutr | 2010 | Meeuwsen S, Horgan GW, Elia M (2010) The relationship between BMI and percent body fat, measured by bioelectrical impedance, in a large adult sample is curvilinear and influenced by age and sex. Clin Nutr 29:560-6. | Human | Fat | Aging;senescence Obesity | |
| Pribis 2010 Nutrients | 2010 | Pribis P, Burtnack CA, McKenzie SO, Thayer J (2010) Trends in body fat, body mass index and physical fitness among male and female college students. Nutrients 2:1075-85. | Human | Obesity | ||
| Bosy-Westphal 2009 Br J Nutr | 2009 | Bosy-Westphal A, Plachta-Danielzik S, Dörhöfer RP, Müller MJ (2009) Short stature and obesity: positive association in adults but inverse association in children and adolescents. Br J Nutr 102:453-61. | Fat | Obesity | ||
| Gnaiger 2009 Int J Biochem Cell Biol | 2009 | Gnaiger E (2009) Capacity of oxidative phosphorylation in human skeletal muscle. New perspectives of mitochondrial physiology. Int J Biochem Cell Biol 41:1837-45. https://doi.org/10.1016/j.biocel.2009.03.013 | Human Mouse | Skeletal muscle | Aging;senescence Obesity | |
| Raboel 2009 Diabetes Obes Metab | 2009 | Raboel R, Hojberg PM, Almdal T, Boushel RC, Haugaard SB, Madsbad S, Dela F (2009) Improved glycaemic control decreases inner mitochondrial membrane leak in type 2 diabetes. Diabetes Obes Metab 11:355-60. | Human | Skeletal muscle | Mitochondrial disease | Diabetes |
| Daussin 2008 Am J Physiol Regul Integr Comp Physiol | 2008 | Daussin FN, Zoll J, Dufour SP, Ponsot E, Lonsdorfer-Wolf E, Doutreleau S, Mettauer B, Piquard F, Geny B, Richard R (2008) Effect of interval versus continuous training on cardiorespiratory and mitochondrial functions: relationship to aerobic performance improvements in sedentary subjects. Am J Physiol Regul Integr Comp Physiol 295:R264-72. | Human | Skeletal muscle | ||
| Romero-Corral 2008 Int J Obes (Lond) | 2008 | Romero-Corral A, Somers VK, Sierra-Johnson J, Thomas RJ, Collazo-Clavell ML, Korinek J, Allison TG, Batsis JA, Sert-Kuniyoshi FH, Lopez-Jimenez F (2008) Accuracy of body mass index in diagnosing obesity in the adult general population. Int J Obes (Lond) 32:959-66. | Human | Fat | Obesity | |
| De Onis 2007 Bull World Health Organization | 2007 | de Onis M, Onyango AW, Borghi E, Siyam A, Nishida C, Siekmann J (2007) Development of a WHO growth reference for school-aged children and adolescents. Bull World Health Organization 85:660-7. | Human | Obesity | ||
| Boushel 2007 Diabetologia | 2007 | Boushel RC, Gnaiger E, Schjerling P, Skovbro M, Kraunsoee R, Dela F (2007) Patients with Type 2 diabetes have normal mitochondrial function in skeletal muscle. Diabetologia 50:790-6. | Human | Skeletal muscle | Diabetes Obesity | |
| Bakkman 2007 ActaPhysiol | 2007 | Bakkman L, Sahlin K, Holmberg HC, Tonkonogi M (2007) Quantitative and qualitative adaptation of human skeletal muscle mitochondria to hypoxic compared with normoxic training at the same relative work rate. Acta Physiol (Oxford) 190:243–51. | Human | Skeletal muscle | Oxidative stress;RONS | |
| Mogensen 2006 J Physiol | 2006 | Mogensen M, Bagger M, Pedersen PK, Fernström M, Sahlin K (2006) Cycling efficiency in humans is related to low UCP3 content and to type I fibres but not to mitochondrial efficiency. J Physiol 571:669-81. | Human | Skeletal muscle | ||
| Ponsot 2006 J Appl Physiol (1985) | 2006 | Ponsot E, Dufour SP, Zoll J, Doutrelau S, N'Guessan B, Geny B, Hoppeler H, Lampert E, Mettauer B, Ventura-Clapier R, Richard R (2006) Exercise training in normobaric hypoxia in endurance runners. II. Improvement of mitochondrial properties in skeletal muscle. J Appl Physiol (1985) 100:1249-57. | Human | Skeletal muscle | Hypoxia | |
| Garnier 2005 FASEB J | 2005 | Garnier A, Fortin D, Zoll J, N'Guessan B, Mettauer B, Lampert E, Veksler V, Ventura-Clapier R (2005) Coordinated changes in mitochondrial function and biogenesis in healthy and diseased human skeletal muscle. FASEB J 19:43-52. | Human | Skeletal muscle | ||
| N'Guessan 2004 Mol Cell Biochem | 2004 | N'Guessan B, Zoll J, Ribera F, Ponsot E, Lampert E, Ventura-Clapier R, Veksler V, Mettauer B (2004) Evaluation of quantitative and qualitative aspects of mitochondrial function in human skeletal and cardiac muscles. Mol Cell Biochem 256-257:267-80. | Human | Skeletal muscle | ||
| Rasmussen 2003 Eur J Physiol | 2003 | Rasmussen UF, Krustrup P, Kjaer M, Rasmussen HN (2003) Human skeletal muscle mitochondrial metabolism in youth and senescence: no signs of functional changes in ATP formation and mitochondrial oxidative capacity. Pflugers Arch – Eur J Physiol 446:270-78. | Human | Skeletal muscle | Aging;senescence | |
| Zoll 2002 J Physiol | 2002 | Zoll J, Sanchez H, N'Guessan B, Ribera F, Lampert E, Bigard X, Surrurier B, Fortin D, Geny B, Veksler V, Ventura-Clapier R, Mettauer B (2002) Physical activity changes the regulation of mitochondrial respiration in human skeletal muscle. J Physiol 543:191-200. | Human | Skeletal muscle | ||
| Rasmussen 2001 Am J Physiol Endocrinol Metab | 2001 | Rasmussen UF, Rasmussen HN, Krustrup P, Quistorff B, Saltin B, Bangsbo J (2001) Aerobic metabolism of human quadriceps muscle: in vivo data parallel measurements on isolated mitochondria. Am J Physiol Endocrinol Metab 280:E301-7. | Human | Skeletal muscle | ||
| Deurenberg 2001 Eur J Clin Nutr | 2001 | Deurenberg P, Andreoli A, Borg P, Kukkonen-Harjula K, de Lorenzo A, van Marken Lichtenbelt WD, Testolin G, Vigano R, Vollaard N (2001) The validity of predicted body fat percentage from body mass index and from impedance in samples of five European populations. Eur J Clin Nutr 55:973-9. | Human | Fat | Obesity | |
| Mettauer 2001 J Am Coll Cardiol | 2001 | Mettauer B, Zoll J, Sanchez H, Lampert E, Ribera F, Veksler V, Bigard X, Mateo P, Epailly E, Lonsdorfer J, Ventura-Clapier R (2001) Oxidative capacity of skeletal muscle in heart failure patients versus sedentary or active control subjects. J Am Coll Cardiol 38:947-54. | Human | Skeletal muscle | Cardiovascular | |
| Cole 2000 BMJ | 2000 | Cole TJ, Bellizzi MC, Flegal KM, Dietz WH (2000) Establishing a standard definition for child overweight and obesity worldwide: international survey. BMJ 320:1240-3. | Human | Obesity | ||
| Gallagher 2000 Am J Clin Nutr | 2000 | Gallagher D, Heymsfield SB, Heo M, Jebb SA, Murgatroyd PR, Sakamoto Y (2000) Healthy percentage body fat ranges: an approach for developing guidelines based on body mass index. Am J Clin Nutr 72:694-701. | Human | Fat | Obesity | |
| Zucker 1962 Committee on Biological Handbooks, Fed Amer Soc Exp Biol | 1962 | Zucker TF (1962) Regression of standing and sitting weights on body weight: man. In: Growth including reproduction and morphological development. Altman PL, Dittmer DS, eds: Committee on Biological Handbooks, Fed Amer Soc Exp Biol:336-7. | Human |
References and links
- Cole TJ, Bellizzi MC, Flegal KM, Dietz WH (2000) Establishing a standard definition for child overweight and obesity worldwide: international survey. BMJ 320:1240-3. - »Bioblast link«
- de Onis M, Borghi E, Arimond M, Webb P, Croft T, Saha K, De-Regil LM, Thuita F, Heidkamp R, Krasevec J, Hayashi C, Flores-Ayala R (2019) Prevalence thresholds for wasting, overweight and stunting in children under 5 years. Public Health Nutrition 22:175-9. - »Bioblast link«
- de Onis M, Onyango AW, Borghi E, Siyam A, Nishida C, Siekmann J (2007) Development of a WHO growth reference for school-aged children and adolescents. Bull World Health Organization 85:660-7. - »Bioblast link«
- Gnaiger E (2019) OXPHOS capacity in human muscle tissue and body mass excess – the MitoEAGLE mission towards an integrative database. 14th Conference on Mitochondrial Physiology: Mitochondrial function: changes during life cycle and in noncommunicable diseases - COST MitoEAGLE perspectives and MitoEAGLE WG and MC Meeting. Belgrade RS, 13-16 Oct 2019. - »Bioblast link«
- Mialich MS, Silva BR, Jordao AA (2018) Cutoff points of BMI for classification of nutritional status using bioelectrical impedance analysis. J Electr Bioimp 9:24-30. - »Bioblast link«
- NCD Risk Factor Collaboration (NCD-RisC) (2017) Worldwide trends in body-mass index, underweight, overweight, and obesity from 1975 to 2016: a pooled analysis of 2416 population-based measurement studies in 128·9 million children, adolescents, and adults. Lancet 390:2627–42. - »Bioblast link«
- Nevill AM, Metsios GS (2015) The need to redefine age- and gender-specific overweight and obese body mass index cutoff points. Nutr Diabetes 5:e186. - »Bioblast link«
- WHO Expert Consultation (2004) Appropriate body-mass index for Asian populations and its implications for policy and intervention strategies. Lancet 363:157-63. - »Bioblast link«
- WHO Multicentre Growth Reference Study Group (2006) WHO child growth standards based on length/height, weight and age. Acta Pædiatrica Suppl 450:76-85. - »Bioblast link«
- WHO Multicentre Growth Reference Study Group (2006) WHO child growth standards: length/height-for-age, weight-for-age, weight-for-length, weight-for-height and body mass index-for-age: Methods and development. Geneva: World Health Organization:312 pp. - »Bioblast link«
- WHO Regional Office for the Western Pacific (2000) The Asia-Pacific perspective: redefining obesity and its treatment. World Health Organization Western Pacific Region 55 pp. - »Bioblast link«
- Zucker TF (1962) Regression of standing and sitting weights on body weight: man. In: Altman PL, Dittmer DS, eds: Growth including reproduction and morphological development. Committee on Biological Handbooks, Fed Amer Soc Exp Biol:336-7. – Anthropometry, H and M°, of the healthy reference population, HRP. - »Bioblast link«
MitoPedia: BME and mitObesity
» Body mass excess and mitObesity | BME and mitObesity news | Summary |
| Term | Abbreviation | Description |
|---|---|---|
| BME cutoff points | BME cutoff | Obesity is defined as a disease associated with an excess of body fat with respect to a healthy reference condition. Cutoff points for body mass excess, BME cutoff points, define the critical values for underweight (-0.1 and -0.2), overweight (0.2), and various degrees of obesity (0.4, 0.6, 0.8, and above). BME cutoffs are calibrated by crossover-points of BME with established BMI cutoffs. |
| Body fat excess | BFE | In the healthy reference population (HRP), there is zero body fat excess, BFE, and the fraction of excess body fat in the HRP is expressed - by definition - relative to the reference body mass, M°, at any given height. Importantly, body fat excess, BFE, and body mass excess, BME, are linearly related, which is not the case for the body mass index, BMI. |
| Body mass | m [kg]; M [kg·x-1] | The body mass M is the mass (kilogram [kg]) of an individual (object) [x] and is expressed in units [kg/x]. Whereas the body weight changes as a function of gravitational force (you are weightless at zero gravity; your floating weight in water is different from your weight in air), your mass is independent of gravitational force, and it is the same in air and water. |
| Body mass excess | BME | The body mass excess, BME, is an index of obesity and as such BME is a lifestyle metric. The BME is a measure of the extent to which your actual body mass, M [kg/x], deviates from M° [kg/x], which is the reference body mass [kg] per individual [x] without excess body fat in the healthy reference population, HRP. A balanced BME is BME° = 0.0 with a band width of -0.1 towards underweight and +0.2 towards overweight. The BME is linearly related to the body fat excess. |
| Body mass index | BMI | The body mass index, BMI, is the ratio of body mass to height squared (BMI=M·H-2), recommended by the WHO as a general indicator of underweight (BMI<18.5 kg·m-2), overweight (BMI>25 kg·m-2) and obesity (BMI>30 kg·m-2). Keys et al (1972; see 2014) emphasized that 'the prime criterion must be the relative independence of the index from height'. It is exactly the dependence of the BMI on height - from children to adults, women to men, Caucasians to Asians -, which requires adjustments of BMI-cutoff points. This deficiency is resolved by the body mass excess relative to the healthy reference population. |
| Comorbidity | Comorbidities are common in obesogenic lifestyle-induced early aging. These are preventable, non-communicable diseases with strong associations to obesity. In many studies, cause and effect in the sequence of onset of comorbidities remain elusive. Chronic degenerative diseases are commonly obesity-induced. The search for the link between obesity and the etiology of diverse preventable diseases lead to the hypothesis, that mitochondrial dysfunction is the common mechanism, summarized in the term 'mitObesity'. | |
| Healthy reference population | HRP | A healthy reference population, HRP, establishes the baseline for the relation between body mass and height in healthy people of zero underweight or overweight, providing a reference for evaluation of deviations towards underweight or overweight and obesity. The WHO Child Growth Standards (WHO-CGS) on height and body mass refer to healthy girls and boys from Brazil, Ghana, India, Norway, Oman and the USA. The Committee on Biological Handbooks compiled data on height and body mass of healthy males from infancy to old age (USA), published before emergence of the fast-food and soft-drink epidemic. Four allometric phases are distinguished with distinct allometric exponents. At heights above 1.26 m/x the allometric exponent is 2.9, equal in women and men, and significantly different from the exponent of 2.0 implicated in the body mass index, BMI [kg/m2]. |
| Height of humans | h [m]; H [m·x-1] | The height of humans, h, is given in SI units in meters [m]. Humans are countable objects, and the symbol and unit of the number of objects is N [x]. The average height of N objects is, H = h/N [m/x], where h is the heights of all N objects measured on top of each other. Therefore, the height per human has the unit [m·x-1] (compare body mass [kg·x-1]). Without further identifyer, H is considered as the standing height of a human, measured without shoes, hair ornaments and heavy outer garments. |
| Length | l [m] | Length l is an SI base quantity with SI base unit meter m. Quantities derived from length are area A [m2] and volume V [m3]. Length is an extensive quantity, increasing additively with the number of objects. The term 'height' h is used for length in cases of vertical position (see height of humans). Length of height per object, LUX [m·x-1] is length per unit-entity UX, in contrast to lentgth of a system, which may contain one or many entities, such as the length of a pipeline assembled from a number NX of individual pipes. Length is a quantity linked to direct sensory, practical experience, as reflected in terms related to length: long/short (height: tall/small). Terms such as 'long/short distance' are then used by analogy in the context of the more abstract quantity time (long/short duration). |
| MitObesity drugs | Bioactive mitObesity compounds are drugs and nutraceuticals with more or less reproducible beneficial effects in the treatment of diverse preventable degenerative diseases implicated in comorbidities linked to obesity, characterized by common mechanisms of action targeting mitochondria. | |
| Obesity | Obesity is a disease resulting from excessive accumulation of body fat. In common obesity (non-syndromic obesity) excessive body fat is due to an obesogenic lifestyle with lack of physical exercise ('couch') and caloric surplus of food consumption ('potato'), causing several comorbidities which are characterized as preventable non-communicable diseases. Persistent body fat excess associated with deficits of physical activity induces a weight-lifting effect on increasing muscle mass with decreasing mitochondrial capacity. Body fat excess, therefore, correlates with body mass excess up to a critical stage of obesogenic lifestyle-induced sarcopenia, when loss of muscle mass results in further deterioration of physical performance particularly at older age. | |
| VO2max | VO2max; VO2max/M | Maximum oxygen consumption, VO2max, is and index of cardiorespiratory fitness, measured by spiroergometry on human and animal organisms capable of controlled physical exercise performance on a treadmill or cycle ergometer. VO2max is the maximum respiration of an organism, expressed as the volume of O2 at STPD consumed per unit of time per individual object [mL.min-1.x-1]. If normalized per body mass of the individual object, M [kg.x-1], mass specific maximum oxygen consumption, VO2max/M, is expressed in units [mL.min-1.kg-1]. |
MitoPedia concepts: MiP concept
Labels:
MitoPedia:BME