Marks - DatLab |
MitoPedia O2k and high-resolution respirometry:
O2k-Open Support
Description
DatLab 8: Marks define sections of a plot set by the user for calibrations, analysis, or to delete marked data points.
DatLab 7: Marks - DatLab 7
Reference: MitoPedia: DatLab
Last update: 2024-10-22
Marks define sections of a plot. They are set by the user in real-time, or post-experimentally to obtain the median, average, standard deviation, outlier index and range of the data within the marked section, for calibration of the oxygen signal, analysis, or to delete marked data points. Marks are shown by a horizontal bar on the upper edge of the graph and a highlighted section inside the graph with the same color of the plot they were set on. They can be classified as free marks, protocol marks, and marks to hide/show data points. Several marks can be set on any plot.
Setting marks
Different types of marks can be set during or after the measurement to get information on a specific section of the plot.
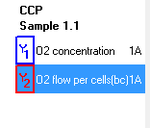
- Protocol marks: are part of a DL-protocol and are displayed sequentially on the protocol sidebar (e.g. M: J°) with the corresponding plot indicated by its color and graph number. By left clicking on the mark in the protocol bar the ‘Mark information’ window pops-up for detailed information and the plot where it should be set is selected. The plot is also selected without opening the ‘Mark information’ window by left clicking on the line with the plot color next to the mark name in the protocol sidebar. If the mark is set on the correct plot and in the correct position, its name is entered according to the mark name in the DL-Protocol.
- Protocol marks can be displayed or hidden in the DL8-Protocol by ticking/unticking the option Protocol marks in the 'Protocols' menu. When the protocol marks are hidden the user only needs to focus on the sequence of events, facilitating the experimental procedure.
- Free marks: are not part of a DL-protocol and are set by the user to get information about a specific section of interest in a plot. The default free mark names are given automatically in alphabetical order, independently for each plot and graph. When deleting a mark this mark letter is missing on the mark list. Marks >z are named as aa (e.g.: aa, ab,...). Extending the default mark names, e.g. from ‘c’ to ’c-TD’, maintains the alphabetical sequence for default names in subsequently generated marks.
- Marks to hide/show data points: Data masks - DatLab
Protocol and free marks can be set by selecting a plot in one of the graphs, and pressing Shift + left click at the chosen starting time point and dragging the cursor over the section to be marked. Marks will be set with the color of the plot.
Marks already set in the graph can be further managed. By right clicking on the section highlighted by the mark, the following procedures can be performed:
- Edit mark: the ‘Mark information’ window pops-up and information related to the mark can be edited. Other possibilities to open the ‘Mark information’ window are left clicking on the horizontal bar of the mark on the upper edge of the graph or on the set mark in the protocol bar, in case of a protocol mark.
- Delete mark: the mark is deleted from the plot. A mark can be also deleted by pressing Shift + right click while dragging the cursor over the mark.
- Drag mark: the mark can be moved along the graph and be set on a different section of the plot by dragging it.
- Expand mark: the size of the mark can be increased or decreased by dragging one of the edges of the section.
Summarized information about a mark is displayed when placing the cursor over it.
Mark information
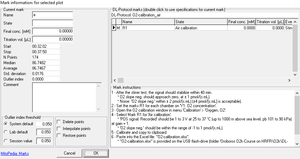
Contains detailed information about the mark and allows its management. In case of DL-Protocol marks, basic information is generally already pre-filled according to the selected DL-Protocol. For free marks, the user should enter the mark information.
- Name: Displays the mark name. Short names are recommended.
- State: Displays information on the mark (e.g. respiratory state)
- Concentration: Displays the final concentration in the chamber of the added chemical based on the corresponding previous event. If only one mark is set for multiple events (e.g. PGM for events P, G and M), a sum of the concentration of the multiple previous events is displayed
- Titration volume [µL]: Displays the volume added to the chamber based on the corresponding previous event. If only one mark is set for multiple events (e.g. PGM for events P, G and M), a sum of the titration volume of the multiple previous events is displayed.
- Start: indicates the initial time of the mark in the plot.
- Stop: indicates the final time of the mark in the plot.
- N points: indicates the number of data points covered by the mark
- Plot [unit]: indicates the plot on which the mark is set
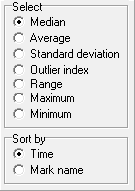
- Median: median of data points within the marked section of the “Plot”
- Average: average of data points within the marked section of the “Plot”.
- Standard deviation: standard deviation of data points within the marked section of the “Plot”.
- Outlier index: Displays the Outlier-skewness index of data points within the marked section of the “Plot”. When a mark with an absolute outlier index value higher than the established threshold is set, a warning (picture) pops up together with the ‘Mark information’ window. A yellow warning triangle is also displayed next to the outlier index field
- Comment: further details and information can be entered into the text field.
- Delete mark: mark can be deleted by left clicking the button.
- Protocol name: displays the name of the selected protocol (if applicable).
- List of marks: lists the DL-protocol marks from the selected dlp8/dlpu8 and related information including name, state, concentration, volume and event before mark.
- Instructions: provides detailed instructions and information on how to correctly set the protocol marks. It is related to the mark selected in the list of marks above.
- OK/Cancel: To save any changes in the window, click on OK, otherwise click on Cancel.
DatLab 7
- Marks in DatLab define sections of a plot recorded over time. Marks are set by the user in real-time, or post-experimentally for basic level data analysis. Set Marks to obtain the median, average, standard deviation, outlier index and range of the data within the mark, for calibration of the oxygen signal, flux analysis, or to delete marked data points. Marks are shown by a horizontal bar in the active plot. The default Mark names are given automatically in numerical sequence, independent for each plot. Rename marks individually by clicking into the horizontal bar, or use corresponding templates for renaming the entire sequence of marks. Several marks can be set on any plot.
Setting marks
- In the Graph menu select "Mouse control: Mark", or press "Ctrl+M". Select the active plot by a left click or touch on the bullet of the plot on the right of a graph. The active plot is highlighted. Shift+L: Set the cursor on the starting position of the mark, hold Shift and press the left mouse button, while moving the cursor along the x-axis. Shift+R: The period of a mark may be reduced or the entire mark deleted by holding Shift and pressing the right mouse button, while moving the cursor along the x-axis over the marked section. Marks cannot overlap within a plot and are separated by one or more data points which are not marked
- Problem: Graph scaling window opens when setting a mark
- When setting a mark on a plot, the Scaling window may appear. This happens if the mouse cursor is set on the time axis.
- Solution: Set marks with the mouse cursor pointed above or below the time axis.
Mark names
- Default mark names: Marks are labelled with consecutive letters by default, starting from "a", independent of the sequence of position of the marks. When deleting a mark (Shift+right click), then this mark letter is missing on the mark list. Marks >z are named as aa (e.g.: aa, ab,...). Extending the default mark names, e.g. from ‘c’ to ’c-TD’, maintains the alphabetical sequence for default names in subsequently generated marks.
Mark information
- Click on the horizontal mark bar to open the window Mark information: for selected plot.
- Name: Edit the mark name.
- State: An explanation of the mark name, frequently giving the units of concentration.
- Final conc.: (optional) The value is used as the concentration or pX value in the Amp or pX calibration windows.
- Titration vol. [µL]: In SUIT protocols, the value is entered as the volume of a titration, for calculating the dilution of sample in DatLab-Excel templates.
- Outlier index: 'High index' - see Details.
- Click on the horizontal mark bar to open the window Mark information: for selected plot.
- The following tick boxes can be selected
- Delete points: Delete data points in the selected mark (no data are lost).
- Interpolate points: Interpolate data points in the selected mark.
- Restore points: Reverses all data points in the graph if they have been deleted or interpolated.
MitoPedia O2k and high-resolution respirometry: DatLab