Difference between revisions of "O2k-Fluo LED2-Module"
| Line 90: | Line 90: | ||
==== The | ==== The Calibration Window ==== | ||
From the MultiSensor menu the '''MultiSensor Calibration''' window <nowiki>[Ctrl+F5] </nowiki> is opened, see [[MiPNet12.08]]. This window allows a simple | From the MultiSensor menu the '''MultiSensor Calibration''' window <nowiki>[Ctrl+F5] </nowiki> is opened, see [[MiPNet12.08]]. This window allows a simple | ||
[[file:DL5 Amp 2point calib.PNG|300px|right]]'''Two-point linear '''calibration of the "Amp channel" (when "Amp" was selected as active plot) as a function of recorded voltage, using known concentrations. | [[file:DL5 Amp 2point calib.PNG|300px|right]]'''Two-point linear '''calibration of the "Amp channel" (when "Amp" was selected as active plot) as a function of recorded voltage, using known concentrations. | ||
| Line 132: | Line 129: | ||
''' | '''Slope based on the raw signal''' | ||
To get the slope calculated from the raw signal instead of from the calibrated signal, activate the check box beside "Calculate slope from raw signal" in the calibration window and then click "Calibrate and Copy to Clipboard". | To get the slope calculated from the raw signal instead of from the calibrated signal, activate the check box beside "Calculate slope from raw signal" in the calibration window and then click "Calibrate and Copy to Clipboard". | ||
Other options include renaming plots, choosing units for calibrated plot and slope, or forcing the slope to be calculated from the raw sinal (instead of from the calibrated signal). | |||
=== Performing an experiment === | === Performing an experiment === | ||
| Line 143: | Line 141: | ||
# Insert the Fluorescence sensors into the window of the O2k chamber and set the desired light intensity. | # Insert the Fluorescence sensors into the window of the O2k chamber and set the desired light intensity. | ||
# Start DatLab and set the desired instrumental parameters (an initial set up is provided in the additional templates for fluorescence) | # Start DatLab and set the desired instrumental parameters (an initial set up is provided in the additional templates for fluorescence) | ||
# Observe the "Amp raw signal" and "slope Amp" as described above | # Observe the "Amp raw signal" and "slope Amp" as described above. It will take some minutes for the sensor to reach a constant temperature and therefore a stable signal. Therefore, it is advisable to insert the fluorescence sensors early in the set up of the instrument. However, they can be removed at any time to visually check the chamber. When a sensor is removed for a short time only it will reach a stable temperature and therefore a stable signal very soon after re-inserting it into the window of the O2k chamber. | ||
# Set up your experiment as usually for respiration experiments. Remove the fluorescence sensors whenever necessary. The time for gaining a stable oxygen signal at open chamber can be used to thermally equilibrate the fluorescence sensors. | # Set up your experiment as usually for respiration experiments. Remove the fluorescence sensors whenever necessary. The time for gaining a stable oxygen signal at open chamber can be used to thermally equilibrate the fluorescence sensors. | ||
# After the chambers are closed and a visual check showed no bubbles (remove the fluorescence sensors from the chamber window for this), switch off the O2k chamber light and start the experiment. You will probable want to observe both the fluorescence channels (Amp) and the oxygen channels. Some initial graph layouts are provided in the additional templates for fluorescence. | # After the chambers are closed and a visual check showed no bubbles (remove the fluorescence sensors from the chamber window for this), switch off the O2k chamber light and start the experiment. You will probable want to observe both the fluorescence channels (Amp) and the oxygen channels. Some initial graph layouts are provided in the additional templates for fluorescence. | ||
Revision as of 14:37, 4 February 2013

![]()


O2k-Fluo LED2-Module

| Description | The O2k-Fluorescence LED2-Module is an amperometric add-on module to the O2k-Core, adding a new dimension to HRR. Optical sensors are inserted through the front window of the O2k-glass chambers, for measurement of hydrogen peroxide production (Amplex red), ATP production (Magnesium green), mt-membrane potential (Safranin), Ca2+ (Calcium green), and numerous other applications open for O2k-user innovation.
The O2k-Fluorescence LED2-Module consists of optical sensors for both O2k-Chambers (LEDs for green and blue excitation), optical filters, Fluorescence-Control Unit for regulation of light intensity, data input into the O2k-Main Unit, and the updated DatLab software. |
|---|---|
| Product ID | 12100-01 |
| Type | O2k, O2k-Module, MultiSensor, Catalogue |
| Link | O2k-Fluorescence@OROBOROS, Oxygraph-2k, G MiPNet17.05 O2k-Fluorescence LED2-Module |
| Image | 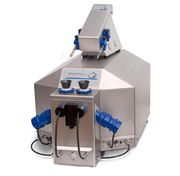 |
The O2k-Fluorescence LED2-Module consists of
The query description has an empty condition.
News
O2k-Fluorometry Workshop: March 2012
- O2k-Fluorometry Workshop from 15 to 16 March 2012, Innsbruck, Austria.
O2k-Manual: O2k-Fluorescence LED2-Module
As an innovation in our 'open innovation' approach, the Manual for the O2k-Fluorescence LED2-Module evolves as a guided tour through the O2k-Catalogue: O2k-Fluorescence LED2-Module.
Setup of the O2k-Fluorescence LED2-Module
- Setup of the O2k-Fluorescence LED2-Module
- Selecting a Fluorescence Sensor
- Mounting a Filter-Cap
- Connect Fluorescence-Sensor to O2k
Electronic settings
Application specific settings
| Application | Sensor | Filter set | Light intensity & | Gain |
|---|---|---|---|---|
| Amplex® UltraRed | Fluorescence-Sensor Green | AmR | 100 - 500 | 1000 (at light intensity = 100) |
| Safranin | Fluorescence-Sensor Blue | Saf | 200 for [safranin] > 2 µM; 500 or higher for [safranin] < 2 µM | 1000 |
| Magnesium green | Fluorescence-Sensor Blue | MgG / CaG | 300 | # |
| Calcium green | Fluorescence-Sensor Blue | MgG / CaG | # |
& as set in Oxygraph /O2k Control/Amp polarisation voltage
#The amplification for Magnesium green(R) and Calcium green(R) will depend on the used concentration of the fluorophore, which may vary drastically between different applications. Therefore, no recommendation for the gain is given.
Both, the light intensity and the amplification (gain) should be optimised for the specific project. Please see Fluorescence-Control_Unit#Control_of_LED-intensity LED-intensity and Fluorescence-Control_Unit#Amplification Amplification. The table above gives only initial values for these optimisations.
Note: The actual current (in mA) used to drive the LED is the value set in DatLab (Amp polarization voltage) divided by 100.
Previously we quoted here the suggested current. To simplify  the operation we now state directly the required DatLab settings.
DatLab-Analysis
Additional Templates for Fluorescence
A DatLab template file with additional templates suitable for fluorescence applications can be downloaded @OROBOROS. Please see MiPNet12.07 for instructions how to import a DatLab Template files.
Observing the Fluorescence Signal
Use Graph Layout “A Amp” to display “Amp Raw Signal”

Graph layout: Three plots are available in DatLab based on the recorded signal: Amp Raw Signal, Amp Calibrated, and Amp Slope. These plots can be selected from the drop-down lines and displayed with their check boxes either on the Y1 or Y2 [Graph layout / Select Plots].
Amp Raw Signal displays the raw voltage (including amplification) as recorded by the Oxygraph at a given gain setting.
Amp Calibrated is the signal after calibration with the parameters set in the MultiSensor Calibration window.
Amp slope is the time derivative of the calibrated signal, multiplied by 1000, in units [m(conc. Unit during calibration)/s], so if the signal was calibrated in µM (nmol / ml) the unit of the slope will be “mili- micro molar/s” that is nM/s (pmol/(ml s)). To get the slope calculated from the raw signal instead of from the calibrated signal check the appropriate box in the calibration window (DatLab 5.1.0.130 and above)
Graphs can be constructed to include both recorded oxygen and fluorescence data, or several graphs can be added to display oxygen and fluorescence data separately. Some layout templates may be provided, which can be modified and saved as appropriate. All graph settings can be saved as user-defined layouts MiPNet12.07.
The Oxygraph Window

In the Configuration Table of the Oxygraph Control window, the used sensor can be entered for documentation purposes.
In the Control Table of the Oxygraph Control window, the gain for the Amp channel can be set in the section “Amp” to 1, 10, 100, or 1000. The gain influences the “Amp Raw Signal” recorded in DatLab. See MiPNet12.06 for a full screen shot of the Control table.
The Calibration Window
From the MultiSensor menu the MultiSensor Calibration window [Ctrl+F5] is opened, see MiPNet12.08. This window allows a simple

Two-point linear calibration of the "Amp channel" (when "Amp" was selected as active plot) as a function of recorded voltage, using known concentrations.
Multiple point linear calibration:
- Do a regression raw voltage in [V] against c in [µM] in a spreadsheet program.
- Note slope and intercept; add the two values to get the value for "slope+intercept"
- Open the MultiSensor calibration window
- Enter the data matrix shown below
- Press Calibrate and Copy to clipboard.

| c [µM] | Select Mark | Raw Signal [V] |
|---|---|---|
| 1 | leave empty | slope + intercept |
| 0 | leave empty | intercept |
Alternative: If the regression was done for c in [µM] against raw voltage in [V] the following data matrix has to be entered:
| c [µM] | Select Mark | Raw Signal [V] |
|---|---|---|
| slope + intercept | leave empty | 1 |
| intercept | leave empty | 0 |
Slope based on the raw signal
To get the slope calculated from the raw signal instead of from the calibrated signal, activate the check box beside "Calculate slope from raw signal" in the calibration window and then click "Calibrate and Copy to Clipboard".
Other options include renaming plots, choosing units for calibrated plot and slope, or forcing the slope to be calculated from the raw sinal (instead of from the calibrated signal).
Performing an experiment
Note: the Fluorescence Sensors can be inserted into the chamber of the O2k at any time during the set up of the instruments
- Choose the appropriate sensor and filter set from the table above, if necessary change the setup of the instrument accordingly
- Insert the Fluorescence sensors into the window of the O2k chamber and set the desired light intensity.
- Start DatLab and set the desired instrumental parameters (an initial set up is provided in the additional templates for fluorescence)
- Observe the "Amp raw signal" and "slope Amp" as described above. It will take some minutes for the sensor to reach a constant temperature and therefore a stable signal. Therefore, it is advisable to insert the fluorescence sensors early in the set up of the instrument. However, they can be removed at any time to visually check the chamber. When a sensor is removed for a short time only it will reach a stable temperature and therefore a stable signal very soon after re-inserting it into the window of the O2k chamber.
- Set up your experiment as usually for respiration experiments. Remove the fluorescence sensors whenever necessary. The time for gaining a stable oxygen signal at open chamber can be used to thermally equilibrate the fluorescence sensors.
- After the chambers are closed and a visual check showed no bubbles (remove the fluorescence sensors from the chamber window for this), switch off the O2k chamber light and start the experiment. You will probable want to observe both the fluorescence channels (Amp) and the oxygen channels. Some initial graph layouts are provided in the additional templates for fluorescence.
Calibration
Different fluorescence applications require very different calibration procedures. For some types of calibrations it will be the best approach to set marks on the "Amp raw signal" and export these to a spreadsheet. Note that for some applications (H2O2 production) the slope of the fluorescence signal, not the signal itself, will be the parameter of biological importance.
Linear Calibration
Note: For the application Amplex(R) (Ultra)red a calibration template, including detailed instructions for use, is available @OROBOROS. The following text provides more general guidelines.
If there is a linear relationship between fluorescence emission and concentration typically a multiple-point calibration is performed, plotting the signal as a function of concentration over a wide concentration range. The obtained regression parameters (slope and intercept) may be used either in a spreadsheet program to calculate averaged concentrations or used via the DatLab calibration window to directly display concentrations. Two point calibrations can be done directly in DatLab, see DatLab-Analysis for both options. For some applications calibrations may be easily done using the Titration-Injection-microPump (TIP2k).
Data export and linear calibration: Mark stable sections on the raw signal, use or generate a template of mark names, and copy to clipboard in Marks Statistics [F2]. Copy into an Excel template for linear regression. This template can be modified according to the specific calibration experiment (titration volumes, concentrations, number of data points, …). Perform a linear regression of the raw signal as a function of analyte concentration. For highest accuracy, only the concentration range used in the final experiment should be included in the regression. Obtain the regression parameters (slope and intercept).
References
- Hickey AJ, Renshaw GM, Speers-Roesch B, Richards JG, Wang Y, Farrell AP, Brauner CJ (2012) A radical approach to beating hypoxia: depressed free radical release from heart fibres of the hypoxia-tolerant epaulette shark (Hemiscyllum ocellatum). J Comp Physiol B 182: 91-100.
- Hunter FW, Wanga J, Patela R, Hsua H-L, Hickey AJ, Haya MP, Wilson WR (2012) Homologous recombination repair-dependent cytotoxicity of the benzotriazine di-N-oxide CEN-209: Comparison with other hypoxia-activated prodrugs. Biochem Pharmacol 83: 574–585.
- Fasching M, Harrison DK, Tretter L, Gnaiger E (2011) Combination of high-resolution respirometry and fluorometry for continuous monitoring of hydrogen peroxide production by mitochondria with resolution in the nanomolar range. Abstract Berlin.
- Sumbalova Z, Harrison DK, Gradl P, Fasching M, Gnaiger E (2011) Mitochondrial membrane potential, coupling control, H2O2 production, and the upper limit of mitochondrial performance. Abstract Kagoshima.
See also
MitoPedia methods: Fluorometry