 |
Oxygen flux - instrumental background |
MitoPedia O2k and high-resolution respirometry:
O2k-Open Support
Description
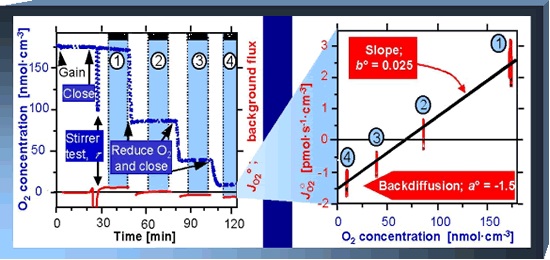
Instrumental background oxygen flux, J°O2, in a respirometer is due to oxygen consumption by the POS, and oxygen diffusion into or out of the aqueous medium in the O2k-chamber. It is a property of the instrumental system, measured in the range of experimental oxygen levels by a standardized instrumental O2 background test. The oxygen regime from air saturation towards zero oxygen is applied generally in experiments with isolated mitochondria, and living or permeabilized cells. To overcome oxygen diffusion limitation in permeabilized fibers and homogenates, an elevated oxygen regime is applied, requiring instrumental background test in the same range of elevated oxygen.
Abbreviation: J°O2
Reference: MiPNet14.06 Instrumental O2 background; Gnaiger_2008_POS; Gnaiger_2001_RespPhysiol
- » See MiPNet14.06 Instrumental O2 background for experimental details of the instrumental background test.
- » See Instrumental:_Browse_DL-Protocols_and_templates for how to find the Template O2 background.xlsx (available with DatLab 7.4 software).
MitoPedia O2k and high-resolution respirometry:
O2k-Open Support
O2 slope in the closed and open O2k-chamber
- Instrumental background correction eliminates errors by systemic flux compensation, performed by DatLab. If no experimental background test has been performed, the system default values are used, which are a°=-2.0 pmol/(s·mL) for the intercept at zero oxygen concentration, and b°=0.025 for the slope of background flux as a function of oxygen concentration.
- Automatic correction for the instrumental background oxygen flux is an essential standard in high-resolution respirometry. At the same time, an instrumental background experiment is an ultimate test for instrumental performance, evaluating chamber performance after completion of all elements of the Oxygen sensor test. The instrumental background oxygen flux measured at air saturation should reflect the theoretically predicted volume-specific oxygen consumption by the oxygen sensor. The actual agreement using experimental respiration medium provides at the same time a test that excludes microbial contamination of the medium or serves to evaluate any autoxidation processes in newly tested experimental media.
- In an open chamber of the O2k the liquid phase in the chamber (aqueous medium) is in equilibrium with the atmosphere. All oxygen consumed by the polarographic oxygen sensor (POS) is immediately replaced from the atmosphere. The oxygen signal, therefore, has to be constant and the (negative) time derivative of the oxygen signal, called "O2 slope uncorr." in DatLab, has to be zero. The background-corrected oxygen flux is meaningless for the open chamber situation. This is because the background correction at air saturation subtracts the consumption of oxygen by the sensor from the negative slope when diffusion into and out of the chamber is zero at air saturation. Therefore, the background-corrected oxygen flux in the open chamber at air saturation is shown as a negative value. To avoid this apparent artifact, the "O2 slope uncorr." is selected to be shown while the chamber is open. Only Graph Layouts that display "O2 slope uncorr." are suitable for assessing the stability of the oxygen signal when the chamber is open. Such Layouts are:
- 01 Calibration show Temp
- 02 Calibration - Background
- In an open chamber of the O2k the liquid phase in the chamber (aqueous medium) is in equilibrium with the atmosphere. All oxygen consumed by the polarographic oxygen sensor (POS) is immediately replaced from the atmosphere. The oxygen signal, therefore, has to be constant and the (negative) time derivative of the oxygen signal, called "O2 slope uncorr." in DatLab, has to be zero. The background-corrected oxygen flux is meaningless for the open chamber situation. This is because the background correction at air saturation subtracts the consumption of oxygen by the sensor from the negative slope when diffusion into and out of the chamber is zero at air saturation. Therefore, the background-corrected oxygen flux in the open chamber at air saturation is shown as a negative value. To avoid this apparent artifact, the "O2 slope uncorr." is selected to be shown while the chamber is open. Only Graph Layouts that display "O2 slope uncorr." are suitable for assessing the stability of the oxygen signal when the chamber is open. Such Layouts are:
- The observation of a zero flux with an open chamber is an important performance parameter. It indicates that thermal stability and equilibrium of oxygen between the gas and aqueous phases have been reached. Therefore no experiment should be started before a zero "O2 slope uncorr." has been reached with an open chamber. The suggested criterion for signal stability is a "O2 slope uncorr." between -1 pmol/(s·mL) and + 1 pmol/(s·mL).
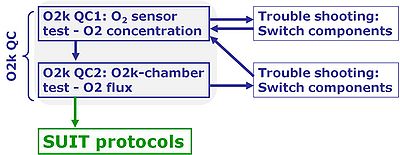
- First step - O2k Quality Control 1: »MiPNet06.03 POS-calibration-SOP«
- Second step - O2k Quality Control 2: »MiPNet14.06 Instrumental O2 background«
Standard operating procedure
- If all quality control criteria of the O2 sensor test are met, the operator can be assured that the quality of the sensor signal is acceptable. Next, the quality of the O2k-chamber assembly has to be tested, described in detail as an O2k-SOP:
- The O2k-chamber test provides quality control at an instrumental level beyond the O2 sensor test:
- O2k-chamber not properly assembled or O2k-glass chamber broken.
- OroboPOS-Holder not properly positioned.
- O2k-Chamber Holder not properly positioned; V- and O-rings not properly mounted (V-ring\30-35-4.5 mm, O-ring\Viton\18x2 mm).
- Volume-Calibration Ring not properly positioned by chamber volume calibration.
- O-ring\Viton\12x1 mm injured and must be replaced on the stopper.
- Stopper\black PEEK\conical Shaft\central Port broken conical edge or O-ring not properly applied.
- OroboPOS-Seal Tip leaky.
- Experimental medium consumes oxygen due to microbial contamination.
- O2k-chamber not properly assembled or O2k-glass chamber broken.
- Next step - when measuring cytochrome c oxidase activity: Autoxidation of ascorbate and TMPD causes a chemical background oxygen flux. DatLab provides real-time correction for instrumental and chemical background.
Instrumental oxygen background test for permeabilized muscle fibers
- While biopsy sampling and fiber preparation proceed: Perform air calibration in MiR06Cr, then close the chamber to evaluate instrumental background at air saturation (c. 10 min): This is a quality control of the medium to check biological contamination.
- Elevate oxygen concentration to 450-500 µM with oxygen gas (Syringe\60 ml\Gas-Injection), close and after two to three min perform a stirrer test (using the automatic stirrer test function of DatLab). This is important, since the OroboPOS may have a different response time at elevated oxygen concentration. If the response time increases dramatically, then the sensor may even show a non-linear response to oxygen concentration at high oxygen levels.
- Instrumental background: After 20 min, open the chamber and allow O2 to drop to c. 350 µM, close for 20 min, open and drop O2 to c. 250 µM (this should be the lowest experimental O2 concentration).
- Increase O2 with H2O2 injection (c. 2 µl) to 400 µM, measure for 15-20 min instrumental background, simulating a re-oxygenation during the experiment.
- Increase O2 with H2O2 injection (c. 1 µl) to 450-500 µM, until the fibers are added, for equilibrating the instrument at high O2.
- Addition of permeabilized fibers into the O2k-chamber: » Permeabilized muscle fibers.
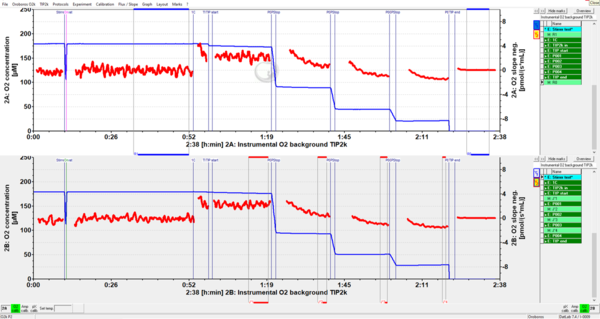
- The instrumental oxygen background test in high oxygen regime can be done using dithionite titrations following the DL-Protocols: Instrumental high O2 background_manual injections or Instrumental high O2 background_TIP2k.
Instrumental O2 DLP
- Instrumental O2k DL-Protocols (DLP) are used for calibrations and instrumental quality control, typically without experimental sample in the incubation medium. All Instrumental DL-Protocols available can be found in C:\DatLab\DL-Protocols\Instrumental\ (default directory after installation of DatLab).
- A general description of DL-Protocols (Instrumental DL-Protocols and SUIT DL-Protocols) is displayed in DL-Protocols.
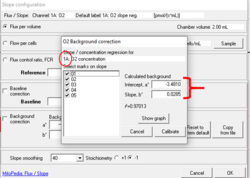
- For instructions on how to upload different instrumental background test parameters (i.e., intercept and slope) from an existing file ('background source'), see: Copy from file option in the Slope configuration window
Instrumental O2 background representative traces
O2k-sV-Module
- Details on the instrumental O2 background test in the small chamber, see: O2k-sV-Module
Troubleshooting
If specifications given in the Instrumental O2 background test are not obtained
- Check components for locating the problem.
- Check the stirring bars for any contamination.
- Check the stoppers for the quality of the O-rings and the conical edges.
- If no indications of a defect are observed, disassemble the O2k-chamber.
- Check the glass chamber for contamination or for broken edges.
- Clean the copper block of the O2k and reassemble the O2k-chamber.
- Reassemble and clean the chambers: MiPNet19.03 O2k-cleaning and ISS.
- Perform an O2 sensor test and - if successful - an O2k-chamber test, using fresh incubation medium.
- If the problem with the instrumental O2 background remains in one chamber, switch stoppers between chambers A and B.
- Perform an O2k-chamber test (the sensor test is not necessary).
- If the problem with the instrumental O2 background remains in the same chamber, switch glass chambers between the left and right side of the O2k.
- Perform an O2 sensor test and - if successful - proceed with the O2k-chamber test.
- If the problem with the instrumental O2 background remains in the same chamber, switch sensors between the left and right chamber.
Oxygen concentration increase at high oxygen regime is not reproducible between chambers after re-oxygenations with O2
- Anonymous user; Heinrich Heine University Düsseldorf
Question: During our run at high oxygen (~400 µM) the chamber won't exponentially oxygenate and won't reach the same level as the other chamber (which contains the same media and was oxygenated with the same syringe). The background calibration is correct as is the gain, stir speed, and temperature. It happens to our O2ks - but different chambers on random different days - and not consistently the same chamber or same O2k. It is usually the same user who processes our muscle biopsies, but I'm pretty sure it's some setting or mistake we're making and not a problem with the actual POS or program. Any help or suggestions are appreciated! The data is attached (2019-12-13).
Answer: When you inject O2 for the first time in both chambers there is an identical slope of the O2 concentration line (although the increase in chamber B is slower). In this situation you need to wait for the desired O2 concentration longer in chamber B than A (which is just fine, such O2 increase can be slow since the OroboPOS may have a different response time at elevated oxygen concentration). Instead, you have injected several times more O2 without waiting long enough for reaching the desired concentration. In fact, that O2 concentration is continuously increasing in chamber B even after the stirrer test. We recommend closing the chamber immediately after reaching the target concentration (~400 µM for pfi), which displaces the gas phase and stops the equilibration process.
- Additionally, your observed issue can be as well related to one or more of the following experimental points:
- Do you always open the stoppers using the Stopper-Spacer making sure that both chambers have the same fixed gas phase?
- Do you check that you have a clear gas phase when you look inside the chamber and not several 'bubbles'?
- Another general points that could lead to dissimilar increase in the O2 concentration (although not applicable in your case):
- Do you inject O2 in the order of 1st chamber A (good chamber) followed by chamber B (bad chamber)? Do you always take fresh O2 before injection between each chamber or do you use the remaining O2 from the 1st injection?
- Do you inject the same amount of O2?
Linear regressions values (intercept - a° and the slope - b°) are very different than the expected values
- Customer ID: US_OH_Cleveland_Hoppel_CL
Question: We performed a high instrumental O2 background and noticed that somehow the values seemed lower than previously although the O2k-trace looks fine. The data is attached (2019-12-03).
Answer: Below you can find the stepwise analysis of your attached data.
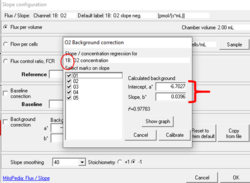
For obtaining the background linear regression: In the window 'O2 Background correction' select only the marks J°1h, J°2h, J°3h and J°4h to calculate the parameters Intercept, a° and Slope, b° and click 'Calibrate'.
| Default parameters of Instrumental high O2 background_TIP2k.DLP | |
|---|---|
| Mark name | O2 concentration [µM] |
| J°1h | ~ 400 |
| J°2h | ~ 370 |
| J°3h | ~ 320 |
| J°4h | ~ 270 |
| Your applied parameters of Instrumental high O2 background (attached DLP) | |
| Mark name | O2 concentration [µM] |
| your J°1h mark (02) | ~ 432 |
| your J°2h mark (03) | ~ 351 |
| your J°3h mark (04) | ~ 235 |
| your J°4h mark (05) | ~ 154 |
By selecting only the marks in the high oxygen regime (only the marks J°1h, J°2h, J°3h and J°4h) and according to the default O2 concentration range for the calibration Instrumental high O2 background_TIP2k.DLP, i.e., de-selecting your mark 05 (which is an outlier from the guidelines: O2 concentration [µM] ~ 154) you can see that your 'a°' values approach the right values of y= -7.6 + 0.0352.
Additionally, I would like to highlight the advantage of including:
- the QC for assuring a contamination-free incubation medium - close O2k-chamber: Quality control e in Oxygen sensor test.
- default parameters under F7 (should be set up prior to O2k connection to the DatLab software): data recording interval: 2.0 seconds; Gain 1; Temperature: 25 or 37 ° C (if overnight run 25° C, otherwise 37 ° C).
Zero oxygen concentration reached but 'Instrumental_O2_background_TIP2k.DLP' is not finished
- - See: O2k open support case
Unstable O2 slope neg. in instrumental background test
- Customer ID: anonymous
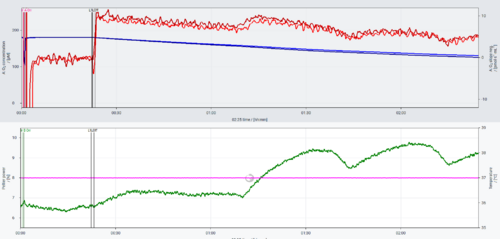
Problem: The O2 instrumental background DLD file contains a drop in the O2 slope neg. after the Dithionite titration event P003. Setting the mark J°4 at this point results in an intercept a° of -5.5782. See data below (2019-12-17).
Solution: According to the DLD file, the mark J°4 immediately after the event P003 is set where the drop in O2 slope neg. occurs. Such a pattern can be explained by convective oxygen backdiffusion (for details, see Gnaiger 2008 POS and O2k-pH_ISE-Module#Instrumental_background_oxygen_flux), which may occur when medium collects in the receptacle of the stopper, such that the liquid phase extends above the level of the capillary of the stopper. This liquid phase equilibrates with room temperature and thus may initiate a convective flow down the capillary in exchange for medium equilibrated at the higher experimental temperature. This is why TIP2k Filter Papers are used, to prevent such a liquid phase from accumulating. Care must be taken to place the TIP2k Filter Papers correctly within the stopper. The marks should always be set on the stable section of the slope (i.e. in this case before the decline of O2 slope neg.). In case of any doubt, it is strongly recommended to repeat the instrumental O2 background test, taking care of the position of the TIP2k Filter Papers. Additionally, it is better to use the layout 02-Calibration Background for a better visualization of the plots, which helps to set the marks properly on stable phases of O2 slope neg.
Fluctuations of O2 slope negative
- Customer ID: anonymous
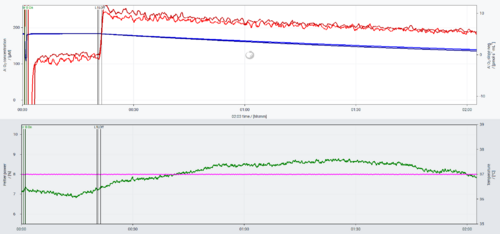
Problem: The O2 instrumental background for sV-Module DLD file shows fluctuations in the O2 slope negative after the chamber was closed. See the data below (2024-04-08).
Solution: The O2k stoppers were facing direct air flow from an air conditioning equipment, switched on about 1 h 10 min after the file started to be recorded. The fluctuations in the Peltier power match the variations in the O2 slope negative. Although the temperature of the chambers was kept stable at 37 °C by the O2k Peltier, the direct airflow led to variations in the O2 flux. The same instrumental background test was repeated with the instrument in the same position, but with the air conditioning equipment switched off and the variations were not observed:
Another solution would be to move the equipment to a position in which it is not in the direction of the air conditioning airflow. On both days (2024-04-08 and 2024-04-11), O2 instrumental background tests were performed in parallel in other O2ks with sV-Module which were placed in the same laboratory room, but away from the airflow from the air conditioning, and no instability of O2 slope negative was observed.
References
- Gnaiger E, Steinlechner-Maran R, Méndez G, Eberl T, Margreiter R (1995) Control of mitochondrial and cellular respiration by oxygen. J Bioenerg Biomembr 27:583-96. - »Bioblast link«
- Gnaiger E (2001) Bioenergetics at low oxygen: dependence of respiration and phosphorylation on oxygen and adenosine diphosphate supply. Respir Physiol 128:277-97. - »Bioblast link«
- Gnaiger E (2008) Polarographic oxygen sensors, the oxygraph and high-resolution respirometry to assess mitochondrial function. In: Mitochondrial dysfunction in drug-induced toxicity (Dykens JA, Will Y, eds) John Wiley:327-52. - »Bioblast link«
- Doerrier C, Garcia-Souza LF, Krumschnabel G, Wohlfarter Y, Mészáros AT, Gnaiger E (2018) High-Resolution FluoRespirometry and OXPHOS protocols for human cells, permeabilized fibers from small biopsies of muscle, and isolated mitochondria. Methods Mol Biol 1782:31-70. - »Bioblast link«
- » Keywords - >>>>>>> - Click on [Expand] or [Collapse] - >>>>>>>
MitoPedia concepts: MiP concept
MitoPedia methods:
Respirometry
MitoPedia O2k and high-resolution respirometry:
DatLab,
Oroboros QM

