Semantic search
| Term | Description |
|---|---|
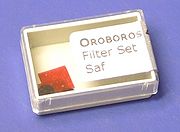
| Filter Set Saf | Filter set Saf: Set of filters for the (qualitative) determination of mitochondrial membrane potential with Safranin. These filters should be used together with Fluorescence-Sensor Blue or Smart Fluo-Sensor Blue. The filter set consists of 6 LED filters (round) and 6 photodiode filters (rectangular). |
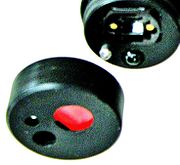
| Filter-Cap | Filter-Cap: O2k-Fluo LED2-Module (O2k-Series D to G) sensors (Fluorescence-Sensor Green and Fluorescence-Sensor Blue) and O2k-FluoRespirometer (O2k-Series H to I) sensors (Smart Fluo-Sensor Green and Smart Fluo-Sensor Blue) are equipped with a removable Filter-Cap for exchange of optical filters for the optical pathways from the LED to the sample and from the sample to the photodiode. |
| Fischer 2021 MitoFit Fe liver | |
| Fischer 2022 MitoFit Fe | |
| Fluo calibration - DatLab | |
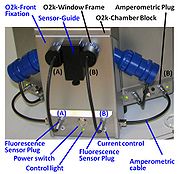
| Fluorescence-Control Unit | Fluorescence-Control Unit with O2k-Front Fixation, Current-Control (O2k-Chamber A and B) for regulation of light intensity of the LED in the fluorescence sensors. This item is a standard component of the O2k-Fluorescence LED2-Module. |
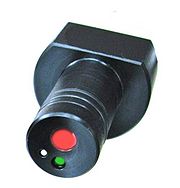
| Fluorescence-Sensor Blue | Fluorescence-Sensor Blue: excitation LED 465 nm (dominant wavelength), photodiode, Filter-Cap equipped with Filter Set Saf for measurement of mitochondrial membrane potential with Safranin when delivered. The filter set Filter Set MgG / CaG for Magnesium green® / Calcium green® measurements is included. |
| Fluorescence-Sensor Green | Fluorescence-Sensor Green: excitation LED 525 nm (dominant wavelength), photodiode, Filter-Cap equipped with Filter Set AmR for Amplex UltraRed measurements when delivered. |
| Flux / Slope | Flux / Slope is the time derivative of the signal. In DatLab, Flux / Slope is the name of the pull-down menu for (1) normalization of flux (chamber volume-specific flux, sample-specific flux or flow, or flux control ratios), (2) flux baseline correction, (3) Instrumental background oxygen flux, and (4) flux smoothing, selection of the scaling factor, and stoichiometric normalization using a stoichiometric coefficient. Before changing the normalization of flux from volume-specific flux to sample-specific flux or flow, or flux control ratios, please be sure to use the standard Layout 04a (Flux per volume) or 04b (Flux per volume overlay). When starting with the instrumental standard Layouts 1-3, which display the O2 slope negative, the sample-specific flux or flow, or flux control ratios will not be automatically background corrected. To obtain the background corrected specific flux or flux control ratios, it is needed to tick the background correction in the lower part of the slope configuration window. Background correction is especially critical when performing measurements in a high oxygen regime or using samples with a low respiratory flux or flow. |
| Flux analysis - DatLab | The strategy of Flux analysis using DatLab depends on the research question and the corresponding settings applied in DatLab when recording the data with the O2k. Usng SUIT protocols, a sequence of respiratory steady-states is measured, marks are set, and numerical data are summarized in Mark statistics (F2). An AI approach is kept in mind when describing guidelines for evaluation of steady-states during data recording and analysis. |
| Flux baseline correction | Flux baseline correction provides the option to display the plot and all values of the flux (or flow, or flux control ratio) as the total flux, J, minus a baseline flux, J0. JV(bc) = JV - JV0 JV = (dc/dt) · ν-1 · SF - J°V For the oxygen channel, JV is O2 flux per volume [pmol/(s·ml)] (or volume-specific O2 flux), c is the oxygen concentration [nmol/ml = µmol/l = µM], dc/dt is the (positive) slope of oxygen concentration over time [nmol/(s · ml)], ν-1 = -1 is the stoichiometric coefficient for the reaction of oxygen consumption (oxygen is removed in the chemical reaction, thus the stoichiometric coefficient is negative, expressing oxygen flux as the negative slope), SF=1,000 is the scaling factor (converting units for the amount of oxygen from nmol to pmol), and J°V is the volume-specific background oxygen flux (Instrumental background oxygen flux). Further details: Flux / Slope. |
| Flux control ratio | Flux control ratios FCRs are ratios of oxygen flux in different respiratory control states, normalized for maximum flux in a common reference state, to obtain theoretical lower and upper limits of 0.0 and 1.0 (0 % and 100 %). For a given protocol or set of respiratory protocols, flux control ratios provide a fingerprint of coupling and substrate control independent of (1) mt-content in cells or tissues, (2) purification in preparations of isolated mitochondria, and (3) assay conditions for determination of tissue mass or mt-markers external to a respiratory protocol (CS, protein, stereology, etc.). FCR obtained from a single respirometric incubation with sequential titrations (sequential protocol; SUIT protocol) provide an internal normalization, expressing respiratory control independent of mitochondrial content and thus independent of a marker for mitochondrial amount. FCR obtained from separate (parallel) protocols depend on equal distribution of subsamples obtained from a homogenous mt-preparation or determination of a common mitochondrial marker. |
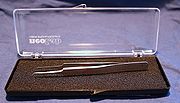
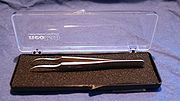
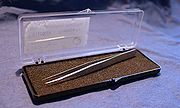
| Forceps for membrane application | Forceps for membrane application: for OroboPOS and ISE membrane application; do not use for tissue preparation. |
| Forceps\stainless Steel\angular Tip\fine | Forceps\stainless Steel\angular Tip\fine: for tissue preparation, stainless steel. Two pairs are used particularly for muscle fiber separation. |
| Forceps\stainless Steel\rounded Tip\sharp | Forceps\stainless Steel\rounded Tip\sharp: for tissue preparation, stainless steel, antimagnetic. One pair is recommended for placing the tissue sample onto the microbalance and for handling in combination with Forceps\stainless Steel\straight Tip\sharp. |
| Forceps\stainless Steel\straight Tip\sharp | Forceps\stainless Steel\straight Tip\sharp: for tissue preparation, stainless steel, antimagnetic. One pair is recommended for insertion of the sample into the O2k-chamber and for handling in combination with Forceps\stainless Steel\rounded Tip\sharp. |
| Fraser 2018 Nature | |
| Full screen | By clicking/enabling Full screen in the Graph-menu in DatLab the currently selected graph is shown alone on the full screen (On) or together with the other defined graphs (Off). Full screen is particularly useful for a single channel overview and for Copy to clipboard [ALT+G B]. |
| Functional Mitochondrial Diagnostics | |
| GDPR | |
| GRC Meeting on Organelles including Mitochondria 2019 West Dover US | |
| GRC Mitochondria and Chloroplasts 2024 Barcelona ES | |
| GRC Mitochondria in Health and Disease 2023 Lucca IT | |
| GRC on Mitochondrial Dynamics and Signaling 2019 Ventura US | |
| GRS on Mitochondria & Chloroplasts 2022 West Dover US | |
| Gain | The gain is an amplification factor applied to an input signal to increase the output signal. |
| Ganguly 2022 MitoFit | |
| Garcia-Roves Pablo Miguel | |
| Getting started - DatLab | Users have to enter their user details the first time they use DatLab 8 on a specific computer. As well, entering some basic settings is required when connecting DatLab 8 with an O2k for the first time. |
| Ginsparg 2017 arXiv | |
| Gnaiger 2012 Mitochondr Physiol Network Bioblast 2012 | |
| Gnaiger 2014 MitoPathways | |
| Gnaiger 2019 MitoFit Preprints | |
| Gnaiger 2019 MitoFit Preprints Editorial | |
| Gnaiger 2020 BEC MitoPathways | |
| Gnaiger 2020 MitoFit x | |
| Gnaiger 2021 MitoFit BCA | |
| Gnaiger Erich | |
| Gnaiger IOC62-Introduction | |
| Gonçalves 2019 Mitofit Preprint Arch EA | |
| Gradl P | |
| Graph control - DatLab | A combination of mouse and keyboard commands provides convenient control of graphs in DatLab 8. |
| Graph layout - DatLab | » See Layout for DatLab graphs. |
| Graph options - DatLab | Several display options can be applied to a DatLab graph under Graph options. |
| Greenland Expedition CMRC 2004 | |
| Gross 2018 Neurology | |
| Gurkina A | |
| HR Split Ljubkovic M | |
| HU Budapest Chinopoulos C | |
| HU Budapest Semmelweis Univ |
