Semantic search
| Term | Description |
|---|---|
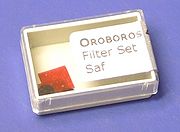
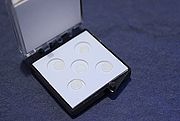
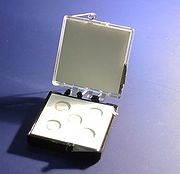
| Filter Set Saf | Filter set Saf: Set of filters for the (qualitative) determination of mitochondrial membrane potential with Safranin. These filters should be used together with Fluorescence-Sensor Blue or Smart Fluo-Sensor Blue. The filter set consists of 6 LED filters (round) and 6 photodiode filters (rectangular). |
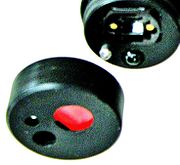
| Filter-Cap | Filter-Cap: O2k-Fluo LED2-Module (O2k-Series D to G) sensors (Fluorescence-Sensor Green and Fluorescence-Sensor Blue) and O2k-FluoRespirometer (O2k-Series H to I) sensors (Smart Fluo-Sensor Green and Smart Fluo-Sensor Blue) are equipped with a removable Filter-Cap for exchange of optical filters for the optical pathways from the LED to the sample and from the sample to the photodiode. |
| Fischer 2021 MitoFit Fe liver | |
| Fischer 2022 MitoFit Fe | |
| Fluo calibration - DatLab | |
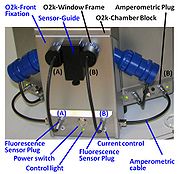
| Fluorescence-Control Unit | Fluorescence-Control Unit with O2k-Front Fixation, Current-Control (O2k-Chamber A and B) for regulation of light intensity of the LED in the fluorescence sensors. This item is a standard component of the O2k-Fluorescence LED2-Module. |
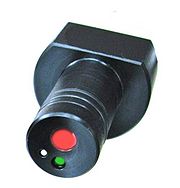
| Fluorescence-Sensor Blue | Fluorescence-Sensor Blue: excitation LED 465 nm (dominant wavelength), photodiode, Filter-Cap equipped with Filter Set Saf for measurement of mitochondrial membrane potential with Safranin when delivered. The filter set Filter Set MgG / CaG for Magnesium green® / Calcium green® measurements is included. |
| Fluorescence-Sensor Green | Fluorescence-Sensor Green: excitation LED 525 nm (dominant wavelength), photodiode, Filter-Cap equipped with Filter Set AmR for Amplex UltraRed measurements when delivered. |
| Flux / Slope | Flux / Slope is the time derivative of the signal. In DatLab, Flux / Slope is the name of the pull-down menu for (1) normalization of flux (chamber volume-specific flux, sample-specific flux or flow, or flux control ratios), (2) flux baseline correction, (3) Instrumental background oxygen flux, and (4) flux smoothing, selection of the scaling factor, and stoichiometric normalization using a stoichiometric coefficient. Before changing the normalization of flux from volume-specific flux to sample-specific flux or flow, or flux control ratios, please be sure to use the standard Layout 04a (Flux per volume) or 04b (Flux per volume overlay). When starting with the instrumental standard Layouts 1-3, which display the O2 slope negative, the sample-specific flux or flow, or flux control ratios will not be automatically background corrected. To obtain the background corrected specific flux or flux control ratios, it is needed to tick the background correction in the lower part of the slope configuration window. Background correction is especially critical when performing measurements in a high oxygen regime or using samples with a low respiratory flux or flow. |
| Flux analysis - DatLab | The strategy of Flux analysis using DatLab depends on the research question and the corresponding settings applied in DatLab when recording the data with the O2k. Usng SUIT protocols, a sequence of respiratory steady-states is measured, marks are set, and numerical data are summarized in Mark statistics (F2). An AI approach is kept in mind when describing guidelines for evaluation of steady-states during data recording and analysis. |
| Flux baseline correction | Flux baseline correction provides the option to display the plot and all values of the flux (or flow, or flux control ratio) as the total flux, J, minus a baseline flux, J0. JV(bc) = JV - JV0 JV = (dc/dt) · ν-1 · SF - J°V For the oxygen channel, JV is O2 flux per volume [pmol/(s·ml)] (or volume-specific O2 flux), c is the oxygen concentration [nmol/ml = µmol/l = µM], dc/dt is the (positive) slope of oxygen concentration over time [nmol/(s · ml)], ν-1 = -1 is the stoichiometric coefficient for the reaction of oxygen consumption (oxygen is removed in the chemical reaction, thus the stoichiometric coefficient is negative, expressing oxygen flux as the negative slope), SF=1,000 is the scaling factor (converting units for the amount of oxygen from nmol to pmol), and J°V is the volume-specific background oxygen flux (Instrumental background oxygen flux). Further details: Flux / Slope. |
| Flux control ratio | Flux control ratios FCRs are ratios of oxygen flux in different respiratory control states, normalized for maximum flux in a common reference state, to obtain theoretical lower and upper limits of 0.0 and 1.0 (0 % and 100 %). For a given protocol or set of respiratory protocols, flux control ratios provide a fingerprint of coupling and substrate control independent of (1) mt-content in cells or tissues, (2) purification in preparations of isolated mitochondria, and (3) assay conditions for determination of tissue mass or mt-markers external to a respiratory protocol (CS, protein, stereology, etc.). FCR obtained from a single respirometric incubation with sequential titrations (sequential protocol; SUIT protocol) provide an internal normalization, expressing respiratory control independent of mitochondrial content and thus independent of a marker for mitochondrial amount. FCR obtained from separate (parallel) protocols depend on equal distribution of subsamples obtained from a homogenous mt-preparation or determination of a common mitochondrial marker. |
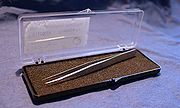
| Forceps for membrane application | Forceps for membrane application: for OroboPOS and ISE membrane application; do not use for tissue preparation. |
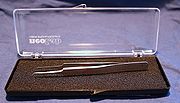
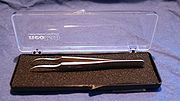
| Forceps\stainless Steel\angular Tip\fine | Forceps\stainless Steel\angular Tip\fine: for tissue preparation, stainless steel. Two pairs are used particularly for muscle fiber separation. |
| Forceps\stainless Steel\rounded Tip\sharp | Forceps\stainless Steel\rounded Tip\sharp: for tissue preparation, stainless steel, antimagnetic. One pair is recommended for placing the tissue sample onto the microbalance and for handling in combination with Forceps\stainless Steel\straight Tip\sharp. |
| Forceps\stainless Steel\straight Tip\sharp | Forceps\stainless Steel\straight Tip\sharp: for tissue preparation, stainless steel, antimagnetic. One pair is recommended for insertion of the sample into the O2k-chamber and for handling in combination with Forceps\stainless Steel\rounded Tip\sharp. |
| Fraser 2018 Nature | |
| Full screen | By clicking/enabling Full screen in the Graph-menu in DatLab the currently selected graph is shown alone on the full screen (On) or together with the other defined graphs (Off). Full screen is particularly useful for a single channel overview and for Copy to clipboard [ALT+G B]. |
| Functional Mitochondrial Diagnostics | |
| GDPR | |
| GRC Meeting on Organelles including Mitochondria 2019 West Dover US | |
| GRC Mitochondria and Chloroplasts 2024 Barcelona ES | |
| GRC Mitochondria in Health and Disease 2023 Lucca IT | |
| GRC on Mitochondrial Dynamics and Signaling 2019 Ventura US | |
| GRS on Mitochondria & Chloroplasts 2022 West Dover US | |
| Gain | The gain is an amplification factor applied to an input signal to increase the output signal. |
| Ganguly 2022 MitoFit | |
| Garcia-Roves Pablo Miguel | |
| Getting started - DatLab | Users have to enter their user details the first time they use DatLab 8 on a specific computer. As well, entering some basic settings is required when connecting DatLab 8 with an O2k for the first time. |
| Ginsparg 2017 arXiv | |
| Gnaiger 2012 Mitochondr Physiol Network Bioblast 2012 | |
| Gnaiger 2014 MitoPathways | |
| Gnaiger 2019 MitoFit Preprints | |
| Gnaiger 2019 MitoFit Preprints Editorial | |
| Gnaiger 2020 BEC MitoPathways | |
| Gnaiger 2020 MitoFit x | |
| Gnaiger 2021 MitoFit BCA | |
| Gnaiger Erich | |
| Gnaiger IOC62-Introduction | |
| Gonçalves 2019 Mitofit Preprint Arch EA | |
| Gradl P | |
| Graph control - DatLab | A combination of mouse and keyboard commands provides convenient control of graphs in DatLab 8. |
| Graph layout - DatLab | » See Layout for DatLab graphs. |
| Graph options - DatLab | Several display options can be applied to a DatLab graph under Graph options. |
| Greenland Expedition CMRC 2004 | |
| Gross 2018 Neurology | |
| Gurkina A | |
| HR Split Ljubkovic M | |
| HU Budapest Chinopoulos C | |
| HU Budapest Semmelweis Univ | |
| HU Budapest Tretter L | |
| HU Debrecen Virag L | |
| HU Szeged Boros M | |
| Haider Markus | |
| Hassan 2020 MitoFit Preprint Arch | |
| Hatch 1998 JAMA | |
| Heichler 2022 MitoFit | |
| Heimler 2022 MitoFit | |
| High signal at zero oxygen | A high signal at zero oxygen may be observed during zero calibration (R0). First, check the quality of the dithionite solution. The following instructions show how to distinguish between a defective sensor head and an electrical leak current. |
| Holzner 2019 MitoFit Preprint Arch EA | |
| Houska Award 2012 | |
| Huete-Ortega 2020 MitoFit Preprint Arch EA | |
| Huete-Ortega Maria | |
| Hydrogen peroxide |
Hydrogen peroxide, H2O2 or dihydrogen dioxide, is one of several reactive oxygen intermediates generally referred to as reactive oxygen species (ROS). It is formed in various enzyme-catalyzed reactions (e.g., superoxide dismutase) with the potential to damage cellular molecules and structures. H2O2 is dismutated by catalase to water and oxygen. H2O2 is produced as a signaling molecule in aerobic metabolism and passes membranes more easily compared to other ROS. |
| Hydrogenion flux | Volume-specific hydrogenion flux or H+ flux is measured in a closed system as the time derivative of H+ concentration, expressed in units [pmol·s-1·mL-1]. H+ flux can be measured in an open system at steady state, when any acidification of the medium is compensated by external supply of an equivalent amount of base. The extracellular acidification rate (ECAR) is the change of pH in the incubation medium over time, which is zero at steady state. Volume-specific H+ flux is comparable to volume-specific oxygen flux [pmol·s-1·mL-1], which is the (negative) time derivative of oxygen concentration measured in a closed system, corrected for instrumental and chemical background. pH is the negative logarithm of hydrogen ion activity. Therefore, ECAR is of interest in relation to acidification issues in the incubation buffer or culture medium. The physiologically relevant metabolic H+ flux, however, must not be confused with ECAR. |
| IE Dublin Miinalainen I | |
| IE Dublin O Gorman D | |
| IE Dublin Porter RK | |
| IL Ramat Gan Yardeni T | |
| IL Rishon Le Zion Hachmo Y | |
| IN Chennai Labmate | |
| IN Haldia Chakrabarti S | |
| IN Hyderabad Thangaraj K | |
| IN Lucknow Gayen JR | |
| IN Mumbai Kolthur-Seetharam U | |
| IN New Delhi Mukhopadhyay A | |
| IN Thiruvananthapuram Gopala S | |
| IN Varanasi Dash D | |
| IOC Innsbruck | |
| IOC Schroecken | |
| IOC recommended reading | |
| IOC student scholarship | |
| IOC05 | |
| IOC10 | |
| IOC13 | |
| IOC16 | |
| IOC165 Wuerzburg DE | |
| IOC166 Ljubljana SI | |
| IOC33 | |
| IOC42 | |
| IOC43 Montevideo UY 2007 | |
| IOC48 | |
| IOC62 | |
| IPC2021 Puerto Varas CL | |
| ISAP 2021 Virtual | |
| ISE Package 1 TPP or Ca | O2k-TPP+ and Ca2+ ISE\1 Chamber: ISE-Package for 1 TPP+ and Ca2+ electrode. |
| ISE-Ca2+ Membranes | ISE-Ca2+ Membranes: PVC, 4 mm diameter, box of 5 membranes. To be used with the O2k-TPP+ ISE-Module. |
| ISE-Compressible Tube | ISE-Compressible Tube for Ion-Selective Electrode TPP+ and Ca2+. |
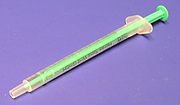
| ISE-Filling Syringe | ISE-Filling Syringe with needle for Ion-Selective Electrode TPP+ and Ca2+. |
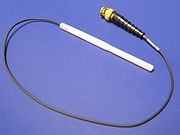
| ISE-Inner Glass Electrode | ISE-Inner Glass Electrode of ISE, with Ag/AgCl- and Pt-wire |
| ISE-Membrane Mounting Tool | ISE-Membrane Mounting Tool for Ion-Selective Electrode TPP+ and Ca2+. O2k-TPP+ ISE-Module: mounting tool included. |
| ISE-Membrane Seal | ISE-Membrane Seal for Ion-Selective Electrode TPP+ and Ca2+. |
| ISE-TPP+ Membranes | ISE-TPP+ Membranes, PVC, 4 mm diameter, box of 5 membranes. |
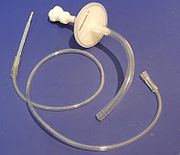
| ISS-Filter and Tubing | ISS-Filter and Tubing, ISS-Integrated Suction System. |
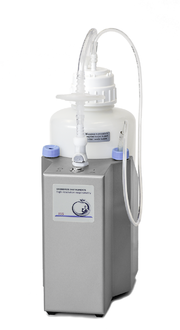
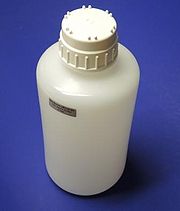
| ISS-Integrated Suction System | ISS-Integrated Suction System: Suction pump with stainless steel housing, 2 liter waste bottle, filter and tubing; for siphoning off excess medium from the O2k-Stopper and for emptying the O2k-chambers. The ISS is included as a standard component of the O2k-FluoRespirometer. Media containing living cells or microorganisms, various poisons (inhibitors, uncouplers) and mixtures of proteins and substrates are safely disposed off in the 2-litre waste bottle. |
| ISS-Lid | ISS-Lid, for ISS-Waste Bottle, component of the ISS-Integrated Suction System. |
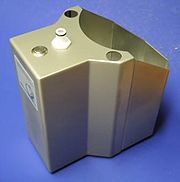
| ISS-Steel Housing | ISS-Steel Housing, a component of the ISS-Integrated Suction System. |
| ISS-Waste Bottle | ISS-Waste Bottle, 2-liter, component of the ISS-Integrated Suction System. |
| IT Bari Atlante A | |
| IT Bari Cantatore P | |
| IT Bari Palmieri L | |
| IT Bologna Genova ML | |
| IT Bolzano Pichler I | |
| IT Cagliari Lai N | |
| IT Catania Messina A | |
| IT Florence Morandi A | |
| IT Foggia Capitanio N | |
| IT Milan Clementi E | |
| IT Naples Iossa S | |
| IT Novara Filigheddu N | |
| IT Padova Morosinotto T | |
| IT Padova Viscomi C | |
| IT Pozzuoli Ligresti A | |
| IT Rome Giuffre A | |
| IT Rome Scatena R | |
| IT Udine Grassi B | |
| IT Udine Mavelli I | |
| IT Verona Calabria E | |
| IT Verona Venturelli M | |
| Iglesias-Gonzalez Javier | |
| Illumination | The chambers of the Oroboros O2k are illuminated by an internal LED. The illumination is switched on and off in DatLab during the experiment by pressing [F10]. This illumination must be distinguished from light introduced into the chambers by LEDs for the purpose of spectrophotometric and fluorometric measurements. For these, the internal illumination must be switched off. |
| Illumination on/off | The illumination in both chambers is switched on/off. |
| Ingram 2020 MitoFit Preprint Arch | |
| Innovationsscheck PLUS | |
| Innovationsscheck PLUS 2 | |
| Install Oroboros protocol package | The standard Instrumental and SUIT DL-Protocols package is automatically implemented with the simple DatLab programme installation. We recommend a 'clean install': rename your previous DatLab programme subdirectory (e.g. C:\DatLab_OLD). Updates and newly developed DL protocols can be simply downloaded by clicking on [Protocols]\Install Oroboros protocol package. |
| Installation and startup support session self-study material | |
| Instrumental: Browse DL-Protocols and templates | Instrumental DL-Protocols (DLP) including DatLab example traces, instructions, brief explanatory texts, links to relevant pages and templates for data evaluation can be browsed from inside DatLab 7.4. Click on menu [Protocols]\Instrumental: Browse DL-Protocols and templates to open a folder with all the DL-Protocols and templates for cleaning, calibration, and background determination provided with the DatLab 7.4. Select a sub-directory and open an DL-Protocol and/or template as desired. |
| Interpolate points | Select Interpolate points in the Mark information window to interpolate all data points in the marked section of the active graph. See also Delete points and Restore points or Recalculate slope. |
| Ion-Selective Electrode TPP+ and Ca2+ | Ion-Selective Electrode TPP+ and Ca2+: ISE with 6 mm outer diameter shaft, for Stopper\white PVDF\angular Shaft\side+6.2+2.6 mm Port. O2k-TPP+ ISE-Module: 2 ISE. |
| Iwema 2016 F1000Research | |
| JP Ibaraki Nakayama T | |
| JP Sagamihara Kobayashi H | |
| JP Sapporo Yokota T | |
| JP Tokushima Okuno H | |
| JP Tokyo Berthold | |
| JP Tokyo Sanyo | |
| JP Tokyo Tanaka M | |
| JP Tokyo Uchino H | |
| Jackson 2002 Notices Amer Mathemat Soc | |
| Jacobs Howard T | |
| Jusic 2019 MitoFit Preprint Arch EA | |
| K-Regio MitoCom Tyrol (de) | |
| K-Regio MitoFit | |
| KR Busan Han J | |
| KR Incheon Kwak HB | |
| KR Seongnam Lee J | |
| KR Seoul Lee HK | |
| KR Seoul Mymed | |
| KR Seoul Pak YK | |
| KR Seoul Scitech Korea | |
| KR Ulsan Lim CH | |
| Kaiser 2017 Science | |
| Kaiser 2017 Science 357 | |
| Karabatsiakis Alexander | |
| Karavyraki 2022 MitoFit | |
| Keyboard shortcuts - DatLab | DatLab provides several keyboard shortcuts to allow for quick access to many functions and settings without using a mouse. |
| King B | |
| Klein 2018 Int J Digit Libr | |
| Kleinert 2018 Lancet | |
| Komlodi 2021 MitoFit AmR-O2 | |
| Komlodi 2021 MitoFit Q | |
| Komlodi Timea | |
| Krako Jakovljevic 2021 MitoFit PD | |
| LT Kaunas Baniene R | |
| LT Kaunas Borutaite V | |
| LT Kaunas Briedis V | |
| LT Vilnius Zimkus A | |
| LV Riga Jansone B | |
| LV Riga Liepins E | |
| Laboratory titration sheet | Laboratory titration sheet contains the sequential titrations in a specific Substrate-uncoupler-inhibitor titration (SUIT) protocol. The laboratory titration sheets for different SUIT protocols are incorporated in DatLab (DL7.1): Protocols in DatLab |
| Laner Verena | |
| Layout for DatLab graphs | A Layout in DatLab selected in the Layout menu yields a standardized display of graphs and plots displayed with specific scalings. The graph layout defines initial settings, which can be modified for plots [Ctrl+F6] and scaling [F6]. A modified layout can be saved as user layout without changing the standard layouts. |
| Learn 2019 Nature | |
| Life Science PhD Meeting 2019 Innsbruck AT | |
| Life Sciences Meeting 2018 Innsbruck AT | |
| Light-enhanced dark respiration | Light-enhanced dark respiration LEDR is a sharp (negative) maximum of dark respiration in plants in response to illumination, measured immediately after switching off the light. LEDR is supported by respiratory substrates produced during photosynthesis and closely reflects light-enhanced photorespiration (Xue et al 1996). Based on this assumption, the total photosynthetic oxygen flux TP is calculated as the sum of the measured net photosynthetic oxygen flux NP plus the absolute value of LEDR. |
| Long Night of Research 2018 Innsbruck AT | |
| Long Night of Research 2020 Virtual Event | |
| Long Night of Research 2022 Innsbruck AT | |
| Long Night of Research 2024 Innsbruck AT | |
| Lower O2 limit - DatLab | A Lower O2 limit [µM] can be defined for each O2k-chamber, to trigger an automatic warning when the experimental O2 concentration drops below this limit. It reminds the user that re-oxygenation of the O2k-chamber may be required. For the lower O2 concentration limit, the critical oxygen concentration should be considered, which differs between isolated mitochondria, large cells, and permeabilized muscle fibers. A higher limit should be chosen when high oxygen flux is expected, e.g. prior to uncoupler titration. A lower limit is acceptable prior to inhibition of respiration causing low oxygen flux. |
| MBSJ 2018 Yokohama JP | |
| MITOEST 2018 Tallinn EE | |
| MX Mexico City Aguirre J | |
| MX Mexico City Pedraza Chaverri J | |
| MX Mexico City Uribe-Carvajal S | |
| MX Mexiko City Moreno-Sanchez R | |
| MX San Pedro Garcia-Rivas G | |
| MY Kuala Lumpur Abdul Karim N | |
| Machado 2019 MitoFit Preprint Arch EA | |
| Maggio 2018 Perspect Med Educ | |
| Magnesium Green | Magnesium Green (MgG) is an extrinsic fluorophore that fluoresces when bound to Mg2+ and is used for measuring mitochondrial ATP production by mitochondrial preparations. Determination of mitochondrial ATP production is based on the different dissociation constants of Mg2+ for ADP and ATP, and the exchange of one ATP for one ADP across the mitochondrial inner membrane by the adenine nucleotide translocase (ANT). Using the dissociation constants for ADP-Mg2+ and ATP-Mg2+ and initial concentrations of ADP, ATP and Mg2+, the change in ATP concentration in the medium is calculated, which reflects mitochondrial ATP production. |
| Manage setups and templates - DatLab | Setups and templates in DatLab can be renamed or deleted under Manage setups or Manage templates. |
| Manuscript template for MitoFit Preprints | Manuscripts template for MitoFit Preprints and Bioenergetics Communications. |
| Mark information | » See Marks - DatLab |
| Mark specifications - DatLab | The function Mark specifications is largely replaced by SUIT DL-Protocols and Instrumental DL-Protocols in DatLab 7.4. Mark specifications allow the user to rename Marks in the active plot and save/recall the settings. Rename marks individually by clicking into the horizontal bar, or use corresponding templates for renaming the entire sequence of marks. |
| Mark statistics - DatLab | In Mark statistics one Plot is selected as a source for Marks over sections of time. Values (e.g. medians) are displayed for these time sections of the source plot and of all selected plots. |
| Marks - DatLab | Marks in DatLab define sections of a plot recorded over time. Marks are set by the user in real-time, or post-experimentally for basic level data analysis. Set Marks to obtain the median, average, standard deviation, outlier index and range of the data within the mark, for calibration of the oxygen signal, flux analysis, or to delete marked data points. Marks are shown by a horizontal bar in the active plot. The default Mark names are given automatically in numerical sequence, independent for each plot. Rename marks individually by clicking into the horizontal bar, or use corresponding templates for renaming the entire sequence of marks. Several marks can be set on any plot. |
| MiP2019/MitoEAGLE Belgrade RS | |
| MiPMap |
The project Mitochondrial Physiology Map (MiPMap) is initiated to provide an overview of mitochondrial properties in cell types, tissues and species. As part of Bioblast, MiPMap may be considered as an information synthase for Comparative Mitochondrial Physiology. Establishing a comprehensive database will require global input and cooperation. A comparative database of mitochondrial physiology may provide the key for understanding the functional implications of mitochondrial diversity from mouse to man, and evaluation of altered mitochondrial respiratory control patterns in health and disease (Gnaiger 2009). |
| MiPNet | |
| MiPNet 26.15 NextGen-O2k Event Photobiology: Algal bioenergetics Innsbruck AT | |
| MiPNet 26.16 NextGen-O2k Summit 2021 Virtual | |
| MiPNet Events | |
| MiPNet02.03 DatLab2 Flux analysis | |
| MiPNet02.04 DatLab2 TimeConstant | |
| MiPNet02.05 DatLab2 O2Kinetics | |
| MiPNet02.06 DatLab2 | |
| MiPNet02.07 Datlab2 Manual | |
| MiPNet03.01 Diagnosis | |
| MiPNet03.02 Chemicals-Media | |
| MiPNet03.03 Internat-Oxygraph-Workshops | |
| MiPNet04.02 DatLab 2.1 | |
| MiPNet04.03 | |
| MiPNet04.04 | |
| MiPNet04.06 IOC18 | |
| MiPNet05.01 | |
| MiPNet05.02 | |
| MiPNet05.03 | |
| MiPNet06.01 O2k-Overview | |
| MiPNet06.03 POS-calibration-SOP | |
| MiPNet06.05 Test Experiments on O2k-Specifications | |
| MiPNet06.06 Chemical O2 background | |
| MiPNet06.07 | |
| MiPNet06.08 Weinatmung | |
| MiPNet06.09 IOC19 | |
| MiPNet07.02 IOC20 | |
| MiPNet07.03 | |
| MiPNet07.04 Oxygraph-2kP2 | |
| MiPNet07.05 IOC21 | |
| MiPNet07.06 Oxygraph-2k | |
| MiPNet07.07 O2k-NetworkInvitation | |
| MiPNet07.08 User information | |
| MiPNet08.02 IOC23 | |
| MiPNet08.03 | |
| MiPNet08.11 IOC24 | |
| MiPNet08.12 IOC22 | |
| MiPNet08.13 mt-Isolation-RLM | |
| MiPNet08.15 Complex-I |
